Abhinav Bhatele (13-ERD-055)
Abstract
As processors have become faster over the years, the cost of a prototypical computing operation, such as a floating-point addition, has rapidly grown smaller. On the other hand, the cost of communicating data has become proportionately higher, necessitating the development of techniques to optimize data movement on the network. Task mapping refers to the placement of communicating tasks on interconnected nodes with the goal of optimizing data movement between them. We focused on developing tools and techniques for mapping application tasks on complex supercomputer network topologies to improve the performance of high-performance computing simulations.
To develop algorithms for task mapping, we first needed to gain a better understanding of congestion on supercomputer networks. We developed tools to quantify network congestion empirically on popular networks and used these tools to measure congestion during application execution. We used the resulting data to build machine learning models that could provide insights into the root causes of network congestion. We also developed the RAHTM (routing algorithm aware, hierarchical task mapping) and Chizu tools to map applications tasks to network topologies. Our results demonstrated significant performance improvements when using task mapping on production high-performance computing applications.
In the course of this project, we identified additional objectives that could assist in completing the main goals of the project. The first was studying inter-job congestion on supercomputer systems in which the network is shared by multiple users and their jobs. The second was developing a network simulator to perform "what-if" analyses impossible to do on a production system, and to study network congestion and task mapping on future supercomputer systems. As a result, we developed Damselfly and TraceR, tools for simulating application execution on supercomputer networks.
Background and Research Objectives
Even on a high-end supercomputer, it takes less than a quarter nanosecond for a floating point addition, compared to the 50 ns needed to access DRAM (dynamic random-access memory) and the thousands of nanoseconds required to receive data from another node. The comparison is also stark when we consider the energy consumed by each task: currently, a floating point operation costs 30 to 45 pJ, an off-chip 64-bit memory access costs 128 pJ, and remote data access over the network costs between 128 and 576 pJ.1 It is imperative to maximize data locality and minimize data movement, both on-and off-node (devices or data points on a computer network), to optimize communication and overall application performance and reduce energy costs.
Our main goal for the project was to minimize communication costs through interconnect-topology-aware task mapping of high-performance computing applications. Task mapping involves understanding the communication behavior of the code and embedding its communication within the network topology, optimizing for performance, power (i.e., data motion), or other objectives. Several Lawrence Livermore application codes have demonstrated significant performance improvements by mapping tasks intelligently to the underlying physical network. The Gordon Bell award-winning submissions for both the Qbox and ddcMD molecular dynamics codes used task mapping to improve performance by more than 60 and 35% respectively, on the Blue Gene/L platform.2,3 For two Livermore programmatic codes, the Kull and ALE3D high-energy-density codes, developers have demonstrated performance improvements of 62 and 27%, respectively, simply by changing the assignment of domains to message-passing interface ranks, which changes the message routing on the physical network.
The mappings mentioned above were created for specific applications or packages targeting a specific architecture. Creating these mappings is time consuming and difficult.4 Complex topologies such as the five-dimensional torus on the Blue Gene/Q Sequoia system at LLNL make this even harder—Qbox, ddcMD, and other application developers have expressed the difficulty of mapping to five dimensions and a need for tools and frameworks that can do this. The work described here has focused on creating these mappings for application developers and end users automatically.
The research objectives of this work were: (1) develop tools to analyze the communication behavior of parallel applications and the resulting network congestion, (2) investigate techniques and develop models to understand network congestion on supercomputers, and (3) design, implement, and evaluate algorithms for mapping tasks in a parallel application to the underlying network topology. In addition to meeting these objectives, we also identified additional objectives in the course of the project. These additional objectives were the study inter-job congestion on supercomputer systems in which the network is shared by multiple users and their jobs, and the development of a network simulator to perform what-if analyses impossible to do on a production system and to study network congestion and task mapping on future supercomputer systems.
Scientific Approach and Accomplishments
Here, we describe the experimental and theoretical methods developed to achieve our objectives and our results.
Measuring Network Congestion
In order to measure congestion empirically on IBM and Cray supercomputer networks, we developed libraries that can record network hardware performance counters on these platforms. These counters, in turn, can record information about the network traffic. The libraries developed for the IBM Blue Gene/Q system and the Cray XC30 (Cascade) system are described below.
BGQNCL: The Blue Gene/Q Network Performance Counters Monitoring Library (BGQNCL) monitors and records network counters during application execution. BGQNCL accesses the "universal performance counter" hardware counters through the Blue Gene/Q hardware performance-monitoring application program interface. The universal performance counter hardware programs and counts performance events from multiple hardware units on a Blue Gene/Q node. BGQNCL is based on the profiling interface for the message passing interface (which is the predominant parallel programming model used in scientific computing) and uses hardware performance monitoring to control the network unit of the universal performance counter hardware.
AriesNCL: The Aries Network Performance Counters Monitoring Library (AriesNCL) monitors and records network router tile performance counters on the Aries router of the Cray XC30 (Cascade) platform. AriesNCL accesses the network router tile hardware counters through the performance application program interface.5
Both BGQNCL and AriesNCL provide an easy-to-use interface to monitor and record network performance counters for an application run. Counters can be recorded for the entire execution or for specific regions or phases marked with "MPI_Pcontrol" calls. These libraries were used extensively in this research and are being released under the GNU operating system Lesser General Public License.
Identifying Culprits Behind Congestion
The ability to predict the performance of communication-heavy parallel applications without actual execution can be very useful. This requires understanding which network hardware components affect communication and, in turn, performance on different interconnection architectures. A better understanding of the network behavior and congestion can help in performance tuning through the development of congestion-avoiding and congestion-minimizing algorithms.
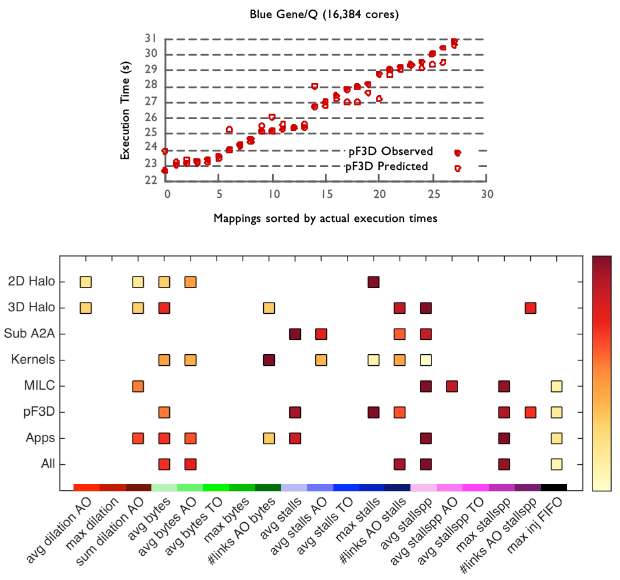
We developed a machine learning approach to understand network congestion on supercomputer networks.6 We used regression analysis on communication data and execution time to find correlations between the two and to learn models for predicting the execution time of new samples. Using our methodology, we obtained prediction scores close to 1.0 for individual applications. We were also able to reasonably predict the execution time on higher node counts using training data for smaller node counts. In addition, we obtained reasonable ranking predictions of execution times for different task mappings of new applications using data sets based on communication kernels only. Figure 1 (top plot) shows the predicted and observed execution times of a laser–plasma interaction code, pF3D, used in Livermore's National Ignition Facility experiments.7
Using a quantile analysis technique to identify relevant feature subsets, we were also able to extract the relative importance of different features and that of the corresponding hardware components in predicting execution time (Figure 1, bottom).8 This helped us to identify the primary root causes or culprits behind network congestion, which is a difficult challenge. We were able to identify the hardware components that are primarily responsible for impacting and ultimately predicting the execution time. These are, in decreasing order of importance, (1) receive buffers on intermediate nodes, (2) network links and (3) injection FIFOs (FIFO, an acronym for "first in, first out," is a method for organizing and manipulating a data buffer, analogous to processing a queue with "first-come, first-served"). We also observed that network hot spots and dilation or the number of hops a message travels are lesser indicators of network congestion. This knowledge gives us a real insight into network congestion on torus network configuration interconnects and can be very useful to network designers and application developers.
Developing and Evaluating Task Mappings
Creating task mappings is time consuming and difficult. Hence, we developed tools and frameworks described below that create these mappings for application developers automatically.
RAHTM: We designed and implemented the routing algorithm aware and hierarchical task mapping RAHTM technique that scales well to 16,000 tasks.9 This technique uses linear programming and overcomes the computational complexity of routing-aware mapping by using a mix of near-optimal techniques and heuristics. The bottom-up approach solves leaf-level problems using near-optimal linear programming techniques and a heuristic (greedy) combining technique to merge leaf-level mapping solutions into a larger whole. RAHTM is an offline mapping tool and its mapping can be used repeatedly in subsequent runs of the application. As such, the cost to derive the mapping is not on the critical execution path and does not add to run-time overheads. Our technique achieves a 20% reduction in communication time, which translates to a 9% reduction in overall execution time for a mix of three communication-heavy benchmarks.
Chizu: Chizu is a framework for mapping application processes or tasks to physical processors or nodes to optimize communication performance. It takes the communication graph of a high-performance computing application and the interconnection topology of a supercomputer as input. The output is a new message-passing interface-rank to processor mapping, which can be used when launching the high-performance computing application within a job partition. Chizu exploits graph-partitioning software available in the public domain such as METIS, Scotch, PaToH, and Zoltan.10–12 It uses a recursive k-way bi-partitioning algorithm that performs recursive partitioning and mapping. The aim is to optimize different communication metrics such as the total number of hops that messages travel, or bisection bandwidth or network interface card congestion. Chizu is under review and is being released under the GNU Lesser General Public License.
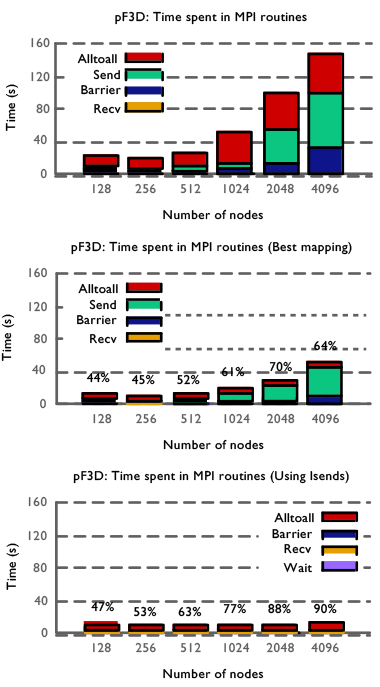
Chizu and a previously developed mapping tool, Rubik,13 have been used to map several LLNL applications and proxy applications including ALE3D, pF3D, Qbox, Kripke, and AMG. Rubik was used to map the pF3D laser–plasma interaction code and MILC (MIMD lattice computation) quantum chromodynamics code, and demonstrated significant performance improvements using task mapping (see Figure 2).14 In the process, we also discovered a long-standing performance bug in pF3D, improving the overall scaling and performance of the code by two to four times.
Studying Inter-Job Congestion and Interference
Our goal here was to investigate the sources of performance variability in parallel applications running on high-performance computing platforms in which the network is shared between multiple jobs running simultaneously on the system. We used pF3D, a highly scalable, communication-heavy, parallel application that is well-suited for such a study because of its inherent computational and communication load balance. We performed our experiments on three different parallel architectures: IBM Blue Gene/P (Dawn and Intrepid), IBM Blue Gene/Q (Mira), and Cray XE6 (Cielo and Hopper).
When comparing variability on the different architectures, we found that there is hardly any performance variability on the Blue Gene systems, and that there is a significant variability on the Cray systems. We discovered differences between the XE6 machines due to their node allocation policies and usage models. Because Hopper is designed to serve small- to medium-sized jobs, the nodes allocated to a job tend to be more fragmented than on Cielo, which mostly serves large jobs. This fragmentation on Hopper resulted in higher variability for pF3D, where the communication time varied from 36% faster to 69% slower when compared to the average. We focused our efforts on investigating the source of the variability on Hopper.
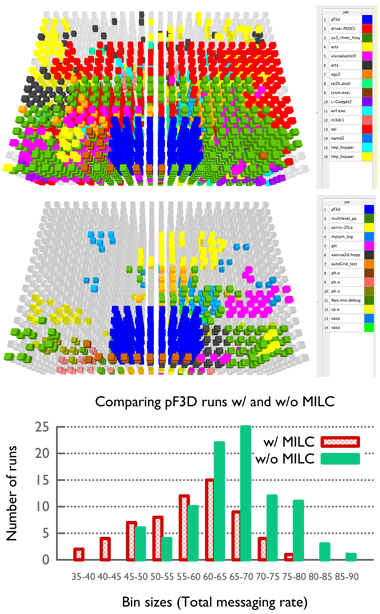
We investigated the impact of operating system noise, shape of the allocated partition, and interference from other jobs on Hopper, and concluded that the primary reason for higher variability is contention for shared network resources from other jobs.15 From queue logs collected during the pF3D runs, we plotted the position of the concurrent jobs relative to pF3D and examined the performance. We found multiple cases where there was strong evidence that the differences in performance are due to communication activities of competing jobs, with message passing rates of pF3D up to 27.8% slower when surrounded by a communication-heavy application such as the MILC code (Figure 3).
Network Simulators and Performance Prediction
Performance prediction tools are important for studying the behavior of high-performance computing applications on large supercomputer systems that are not deployed yet or have access restrictions. They are needed to understand the messaging behavior of parallel applications in order to prepare them for efficient execution on future systems. We have developed two methods for simulating the communication of high-performance computing applications on supercomputer networks: Damselfly (for functional modeling) and TraceR (for trace-driven simulation). Damselfly and TraceR are being released under the GNU Lesser General Public License.
Damselfly: Damselfly is a model-based network simulator for modeling traffic and congestion on the dragonfly topology network designed by Cray.16 Given a router connectivity graph and an application communication pattern, the network model in Damselfly performs an iterative solve to redistribute traffic from congested to less-loaded links. Damselfly was used to explore the effects of job placement, parallel workloads, and network configurations on network health and congestion.17 Because Damselfly models steady-state network traffic for aggregated communication graphs as opposed to communication traces with time stamps, it does not model and/or predict execution time.
TraceR: Predicting execution time requires a detailed cycle-accurate (or flow-control digits or packet-level) simulation of the network. TraceR is designed as an application on top of the CODES (co-design of exascale storage) simulation framework, which uses highly parallel simulation to explore the design of exascale storage architectures and distributed data-intensive science facilities.18 It uses traces generated by BigSim’s emulation framework19 to simulate an application’s communication behavior by leveraging the network application programming interface exposed by CODES. It uses the Rensselaer Optimistic Simulation System as the parallel discrete-event simulation engine to drive the simulation.20 TraceR can output network traffic as well as predicted execution time.
To the best of our knowledge, TraceR is the first network simulator that enables simulations of multiple jobs with support for per job, user-defined job placement, and task mapping. We have shown that TraceR performs significantly better than other state-of-the-art simulators such as SST and BigSim.21,22 Figure 4 shows the sequential and parallel performance of TraceR when simulating a three-dimensional torus network. TraceR also supports other supercomputer network topologies such as dragonfly and fat-tree.
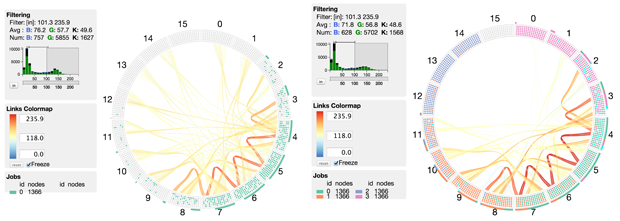
We have been using Damselfly and TraceR to perform various what-if studies and performance prediction. Figure 5 shows a representative result from our studies in which the effect of executing multiple jobs simultaneously on network traffic is compared with that of running a job alone.
Accomplishments
By the conclusion of this project, we had released six software tools related to congestion analysis, task mapping, and network simulation. Using tools developed for task mapping, we improved the performance of pF3D, MILC, and Qbox codes significantly. Plots in Figure 2 show the time spent by pF3D in different message passing interface routines for the default mapping, the best mappings we found, and the best mappings combined with the Isend optimization. The labels in the center and bottom plot denote the percentage reduction in communication time compared to the default ABCDET mapping. Tiled mappings improve the communication performance of pF3D on Blue Gene/Q by 2.8x on 4,096 nodes, and the Isend modification improves it further by 3.9x. Task mappings developed for Qbox were used for scaling it on Sequoia and generating results for a Gordon Bell submission.
In general, the prediction techniques we developed are widely applicable to a variety of scenarios, such as (1) creating offline prediction models that can be used for low-overhead tuning decisions to find the best configuration parameters; (2) predicting the execution time in new setups (e.g., on a different number of nodes, or different input data sets, or even for an unknown code); (3) identifying the root causes of network congestion on different architectures; and (4) generating task mappings for good performance.
Impact on Mission
The work on this project is directly aligned with Livermore’s score competency in high-performance computing, simulation, and data science. Our work included fundamental computer science research on large-scale graph-embedding algorithms, and the tools developed can be used to improve the performance of highly scalable high-performance computing applications for LLNL programs.
Conclusion
In summary, research conducted in this project has led to: (1) a better understanding of network congestion on torus networks, (2) development of a methodology for highly accurate performance prediction using machine learning models, (3) design of tools for task mapping and performance improvements of production scientific applications, and (4) development of network simulators for performing what-if analyses. Scalable network simulators such as TraceR are a powerful tool to study high-performance computing applications and architectures. In the future, we plan to use TraceR to compare different network topologies and understand deployment costs versus performance tradeoffs. We will also use network simulations to identify performance bottlenecks in production applications on supercomputing systems to be deployed in the near future.
Procurement, installation, and operation of supercomputers at high-performance computing facilities is expensive in terms of time and money. It is important to understand and evaluate various factors that can impact overall system utilization and performance. In this project, we focused on analyzing network congestion, because communication is a common performance bottleneck. Such analyses coupled with the monetary costs of configuration changes can inform future supercomputer purchases and potential upgrades by DOE and LLNL. Our performance prediction and visualization tools can be used by machine architects, system administrators, and end users to understand application, network, and/or overall system performance.
We plan to extend our investigations on inter-job congestion by using a lightweight monitoring framework to collect system-wide performance data and archive it for data mining experiments. We are setting up collaborations with researchers at the University of Illinois, National Center for Supercomputing Applications and the University of Arizona, in this area. We are also in negotiations with the University of Illinois, National Center for Supercomputing Applications to establish a CRADA (cooperative research and development agreement) via the National Science Foundation’s Petascale Application Improvement Discovery program. The subcontract to LLNL has already been approved by the National Science Foundation and is pending approval by the University of Illinois, LLNL, and DOE.
References
- Kogge, P., et al., Exascale computing study: Technology challenges in achieving exascale systems. DARPA/IPTO.(2008).
- Gygi, F., et al., "Large-scale electronic structure calculations of high-Z metals on the Blue Gene/L platform." Proc. Supercomputing 2006. Intl. Conf. High Performance Computing, Network, Storage, and Analysis. (2006).
- Streitz, F. H., et al., "100+ TFlop solidification simulations on BlueGene/L." Proc. Intl. Conf. Supercomputing. ACM Press. (2005). UCRL-CONF-211681.
- Bokhari S. H. "On the mapping problem." IEEE Trans. Comp. 30(3), 207 (1981).
- Mucci, P. J., et al., "PAPI: A portable interface to hardware performance counters." Proc. Department of Defense HPCMP User Group Conference. (1999).
- Jain, N., et al., Predicting application performance using supervised learning on communication features. Intl. Conf. High Performance Computing, Networking, Storage and Analysis, Denver, CO, Nov. 17–22, 2013. LLNL-CONF-635857.
- Langer, S., et al., Cielo full-system simulations of multi-beam laser-plasma interaction in NIF experiments. Cray Users Group 2011, Fairbanks, AK, May 23–26, 2011.
- Bhatele, A., et al., "Identifying the culprits behind network congestion." Proc. IEEE Intl. Parallel and Distributed Processing Symp. IEEE Computer Society. (2015). LLNL-CONF-663150.
- Abdel-Gawad, A., M. Thottethodi, and A. Bhatele, RAHTM: Routing algorithm aware hierarchical task mapping. Intl. Conf. High Performance Computing, Networking, Storage and Analysis, New Orleans, LA, Nov. 16–21, 2014. LLNL-CONF-653568.
- Karypis, G., and V. Kumar, "Multilevel k-way partitioning scheme for irregular graphs." J. Parallel Distr. Comput. 48, 96 (1998).
- Chevalier, C., et al., "Improvement of the efficiency of genetic algorithms for scalable parallel graph partitioning in a multi-level framework." Proc. Euro-Par 2006, LNCS, 4128:243252, p. 243 (2006).
- Devine, K. D., et al., "New challenges in dynamic load balancing." Appl. Numer. Math. 52(2–3),133 (2005).
- Bhatele, A., et al., "Mapping applications with collectives over sub-communicators on torus networks." Proc. ACM/IEEE Intl. Conf. High Performance Computing, Networking, Storage and Analysis. IEEE Computer Society. (2012). LLNL-CONF-556491.
- Bhatele, A., et al., "Improving application performance via task mapping on IBM Blue Gene/Q." Proc. IEEE Intl. Conf. High Performance Computing. IEEE Computer Society. (2014). LLNL-CONF-655465.
- Bhatele, A., et al., There goes the neighborhood: Performance degradation due to nearby jobs. Intl. Conf. High Performance Computing, Networking, Storage and Analysis, Denver, CO, Nov. 17–22, 2013. LLNL-CONF-635776.
- Faanes, G., et al., "Cray cascade: A scalable HPC system based on a dragonfly network." Proc. Intl. Conf. High Performance Computing, Networking, Storage and Analysis. IEEE Computer Society Press. (2012).
- Jain, N., et al., Maximizing throughput on a Dragonfly network. Intl. Conf. High Performance Computing, Networking, Storage and Analysis, New Orleans, LA, Nov. 16–21, 2014. LLNL-CONF-653557.
- Cope, J., et al., "Codes: Enabling co-design of multilayer exascale storage architectures." Proc. Workshop on Emerging Supercomputing Technologies. (2011).
- Zheng, G., et al., "Simulation-based performance prediction for large parallel machines." Int. J. Parallel Program. 33, 183 (2005).
- Bauer Jr., D. W., C. D. Carothers, and A. Holder, "Scalable time warp on blue gene supercomputers." Proc. 2009 ACM/IEEE/SCS 23rd Workshop on Principles of Advanced and Distributed Simulation. IEEE Computer Society. (2009).
- Acun, B., et al., "Preliminary evaluation of a parallel trace replay tool for HPC network simulations." Proc. 3rd Workshop on Parallel and Distributed Agent-Based Simulations. (2015). LLNL-CONF-667225.
- Underwood, K., M. Levenhagen, and A. Rodrigues, "Simulating Red Storm: Challenges and successes in building a system simulation." IEEE Intl. Parallel and Distributed Processing Symp., Mar. 26–30, 2007, Long Beach, CA (2007).
Publications and Presentations
- Acun, B., et al., Preliminary evaluation of a parallel trace replay tool for HPC network simulations. Proc. 3rd Workshop Parallel and Distributed Agent-Based Simulations. (2015). LLNL-CONF-667225.
- Abdel-Gawad, A., M. Thottethodi, and A. Bhatele, RAHTM: Routing algorithm aware hierarchical task mapping. Intl. Conf. High Performance Computing, Networking, Storage and Analysis, New Orleans, LA, Nov. 16–21, 2014. LLNL-CONF-653568.
- Bhatele, A., Task mapping, job placements, and routing strategies. 12th Ann. Charm++ Workshop, Champaign-Urbana, IL, Apr. 29–30, 2014. LLNL-ABS-653685.
- Bhatele, A., and T. Gamblin, OS/runtime challenges for dynamic topology-aware mapping. U.S. DOE Exascale OS/R Workshop, Washington, DC, Oct. 3–4, 2012. LLNL-PRES-587572.
- Bhatele, A., and T. Gamblin, Placing communicating tasks apart to maximize bandwidth. SIAM Conf. Computational Science and Engineering, Boston, MA, Feb. 25–Mar. 1, 2013. LLNL-PRES-621732.
- Bhatele, A., et al., "Identifying the culprits behind network congestion." Proc. IEEE Intl. Parallel and Distributed Processing Symp. IEEE Computer Society. (2015). LLNL-CONF-663150.
- Bhatele, A., et al., On predicting performance of different task mappings using supervised learning. SIAM Conf. Parallel Processing for Scientific Computing, Portland, OR, Feb. 18–21, 2014. LLNL-ABS-647552.
- Bhatele, A., et al., Optimizing the performance of parallel applications on a 5D torus via task mapping. 21st Ann. IEEE Intl. Conf. High Performance Computing, Goa, India, Dec. 17–20, 2014. LLNL-CONF-655465.
- Bhatele, A., et al., There goes the neighborhood: Performance degradation due to nearby jobs. Intl. Conf. High Performance Computing, Networking, Storage and Analysis, Denver, CO, Nov. 17–22, 2013. LLNL-CONF-635776.
- Jain, N., et al., Maximizing throughput on a dragonfly network. Intl. Conf. High Performance Computing, Networking, Storage and Analysis, New Orleans, LA, Nov. 16–21, 2014. LLNL-CONF-653557.
- Jain, N., et al., Predicting application performance using supervised learning on communication features. Intl. Conf. High Performance Computing, Networking, Storage and Analysis, Denver, CO, Nov. 17–22, 2013. LLNL-CONF-635857.
- Menon, H., et al., “Applying graph partitioning methods in measurement-based dynamic load balancing.” ACM Trans. Parallel Comput. (2014). LLNL-JRNL-624112.


