Liang Min (13-ERD-043)
Abstract
Tomorrow’s electric grid will increasingly include renewable resources and electric energy storage in both transmission (delivering power from generation to distribution circuits) and distribution (delivering power from distribution circuits to consumers). This electric grid will require simulations that can ensure reliable long-term operation of an extremely complex system comprised of millions of distributed units. We have developed the first platform in the power energy community supporting large-scale integrated transmission and distribution systems simulation. We created a modeling and simulation tool that can be used for integrated analysis of transmission, distribution, and communication networks. A high-performance coupled transmission and distribution simulator was developed for electric-power-grid simulation, and two case studies were conducted to evaluate the performance of the simulator. A 179-bus bar version of the Western Electricity Coordinating Council power grid was selected to test the transmission grid, and a Pacific Gas and Electric distribution feeder was used to represent distribution systems. The transmission and distribution model was coupled to an open-source network simulation, ns-3, through a federated simulation toolkit. The third case study, a wide-area communication electric-transmission protection scheme using the IEEE (Institute of Electrical and Electronics Engineers) 39-bus test system, was simulated with a federated simulation toolkit.
Background and Research Objectives
Simulation technology for electric grid operations has been developed over the last several decades in a piecemeal fashion, within narrow functional areas and well before the development of modern computational capabilities. As such, current simulation technology is insufficient to address pending complex "smart-grid" systems simulation where modeling effects of renewables and energy storage in the distribution network will have significant impacts throughout the entire grid. The electric power industry is progressively moving toward these smart grids, which can be thought of as a combination of electricity infrastructure (generation, transmission, and distribution) and intelligence infrastructure (sensing and measurement, control, and communication). While each of these infrastructures alone has well-defined behavior, their coupling may lead to unexpected or unforeseen emergent behavior.1 Furthermore, it is currently challenging to study new smart-grid systems in a holistic way, especially at the scales required to understand and support future grid flexibility, security, and reliability.
In the last few years, parallel computing techniques, new mathematical algorithms, and other related technologies have become readily available. These hold the promise for faster simulation methods and scalability necessary for next-generation electric grid operation and simulation systems. Given these needs and the current practice of simulating transmission, distribution, and communication as separate systems, a gap exists in large-scale, high-performance-computing federated co-simulation of transmission, distribution, and communication systems.
Our research goals initially focused on coupled simulation of transmission and distribution. For this simulation, our objectives were to develop a software framework on which we can evaluate coupled simulation methodologies for integrated transmission and distribution systems, as well as develop efficient numerical methods and parallel algorithms enabling coupled simulations on high-speed, state-of-the-art computers at Lawrence Livermore. Additionally, we increased our project scope by developing a methodology and supporting software for co-simulation of electric grid and communication networks. All of our objectives were met.
Scientific Approach and Accomplishments
Our first task was to evaluate existing software packages and determine how best to capture a transmission system simulation capability for this project. After evaluating existing packages, we found none that were open source in their dynamics, which would allow us to apply parallel computing and coupling to distribution, and none that were adapted to high-performance computing machines.
Thus, we developed a new high-performance-computing, power-transmission-system simulator, GridDyn. Models in GridDyn are divided into three types. Primary objects include areas, busses (high-current metal-bar conductors used in distribution substations to connect different circuits and to transfer power from the power supply to multiple distribution feeders), links (such as transmission lines), and relays. Secondary objects are those that attach to a bus, such as loads and generators. Sub-models control the dynamic behavior of the other components. Mechanisms are also in place to instrument the system and extract desired information or manipulate the system through events and changes in the models (e.g., triggering a fault). Numerous solution modes are available, including direct-current power flow, alternating-current power flow, stepped power flow, and a full dynamic solution.
Our GridDyn simulator uses an implicit differential algebraic equation solver (IDA) for time integration of the transient system.2 The IDA package uses a variable step and order method for implicit integration. Hence, the solution returned is not subject to pollution from error generated by a large, fixed-time step. The code exploits periods of low dynamics to take larger step sizes. In addition, IDA provides the capability to check for roots of specified equations at each time step. This feature is used by GridDyn to detect when changes in equipment monitored by the communication network occur. Integration in IDA is conducted either to a specified stop time or to an earlier time when a root is found.
Objective 1. Coupled Transmission and Distribution Simulator
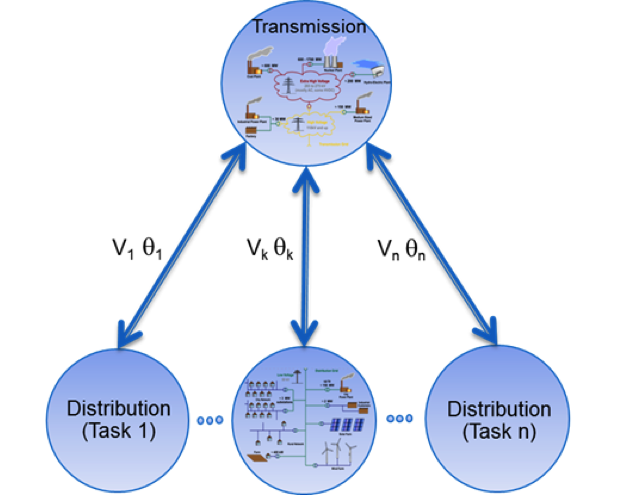
The GridDyn simulator was coupled with GridLAB-D, an open-source electric-distribution-system simulator developed at Pacific Northwest National Laboratory in Richland, Washington. To allow coupling with GridDyn, we modified GridLAB-D to communicate via a message-passing interface and inject a voltage in the swing bus of the system. The voltage information is sent from the bus in GridDyn, which is the attachment point for a GridLAB-D model. GridDyn approximates the GridLAB-D network as a ZIP model load, which gets updated if the voltage swings significantly and at periodic time intervals. The ZIP model is equivalent to a second-order approximation of the voltage–current relationship of the GridLAB-D system, and was chosen because it is also the base model for many internal GridLAB-D loads and an exact representation of the aggregate system in many relevant simulations. The processor tasking for coupled simulation is shown in Figure 1.
Two case studies were conducted to evaluate the performance of the co-simulation tool. First, we performed a steady-state active power–voltage curve analysis using scaled-up demand response at the distribution level to offset the need for load shedding and to avoid voltage collapse. Second, a dynamic voltage stability assessment was performed using smart inverters at the distribution level to provide dynamic volt–ampere reactive support to the transmission level.
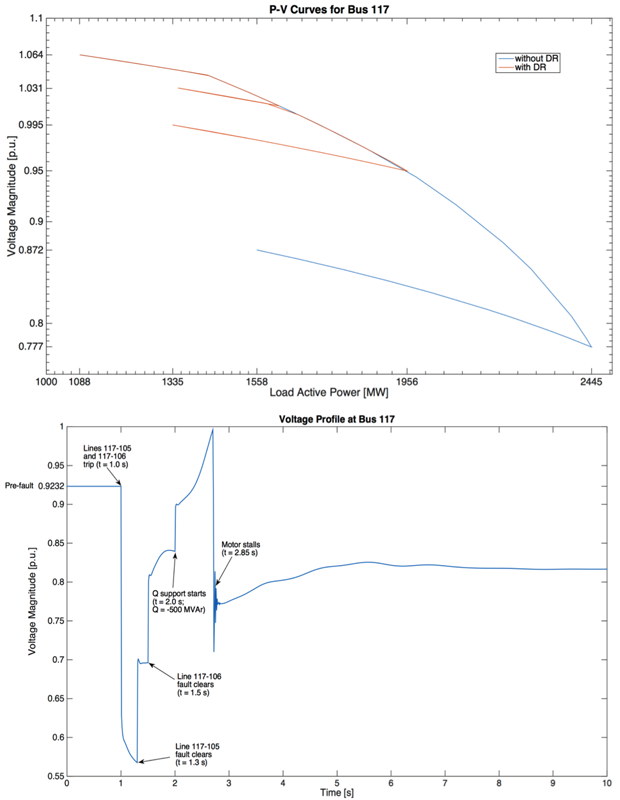
Figure 2 shows results of coupling GridLAB-D and GridDyn for repeated power-flow and dynamic solutions. In both simulations, a 179-bus version of the Western Electricity Coordinating Council power grid is chosen as a test transmission grid. A Pacific Gas and Electric distribution feeder is used to represent distribution systems. Multiple identical distribution systems are connected to the transmission load bus (i.e., bus 117) to realize a coupled transmission–distribution grid. At the outset, bus 117 is set to have a zero base-case loading. Then, 135 duplicate GridLAB-D feeders are attached to bus 117.
Figure 2 (top) displays the two power–voltage curves under such coupling scenario with and without demand-response functionality. It can be seen that the static voltage-stability margin is larger when the demand response is not introduced. For dynamic simulation, 100 duplicate GridLAB-D feeders are connected to the same transmission bus. Figure 2 (bottom) illustrates the performance of the co-simulation environment under the fault-induced delayed voltage-recovery scenario involving two simultaneous transmission-line faults. After two faults are cleared successively, volt–ampere reactive support is initiated to boost the voltage level followed by the stall of an induction motor installed at bus 117. This event results in a post-fault voltage level that is 10% below the pre-fault level, as well as a prolonged recovery of the bus voltage.
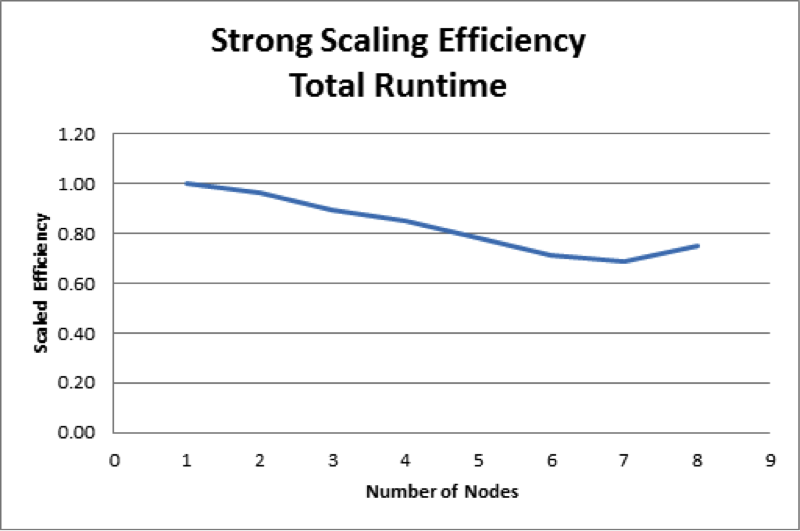
Figure 3 shows strong-scaling efficiency for a steady-state co-simulation. In all data points, 127 GridLAB-D instances are utilized in addition to a GridDyn instance, resulting in a total of 128 tasks (the largest number of tasks that can run on a single node). As nodes and cores are added to the solution, a scaling efficiency of 70% or more is attained in all cases.
Objective 2. A Federated Simulation Toolkit for Grid and Communication Network Co-Simulation
The GridDyn simulator was coupled to the open-source network simulator, ns-3 (nsnam.org), through a middleware component, a federated simulator toolkit (FISKIT) we developed for this project. The ns-3 is a discrete-event network simulator for Internet systems. Because of its open and extensible nature, ns-3 is a prime platform for study of smart-grid networks. We favored ns-3 over other network simulators primarily because of this extensibility, and our experience with ns-3 for other applications. We adapted it to operate in a co-simulation environment and extended it to support a particular smart-grid application from the literature.
We coupled transmission and communication simulators through implementation and use of FISKIT. To federate simulators, two key capabilities are needed: control of the time advancement of the simulators and communication between objects in the federate. After investigating existing federated systems, we decided to author a simple toolkit allowing us to federate parallel simulators, such as ns-3, running across multiple nodes, and use message-transport layers that are optimized for high-performance computing. FISKIT supports coupling multiple continuous and discrete-event parallel simulations. Because each of the federated simulators has existing notions of time and event ordering, time advancement of federates must be controlled.
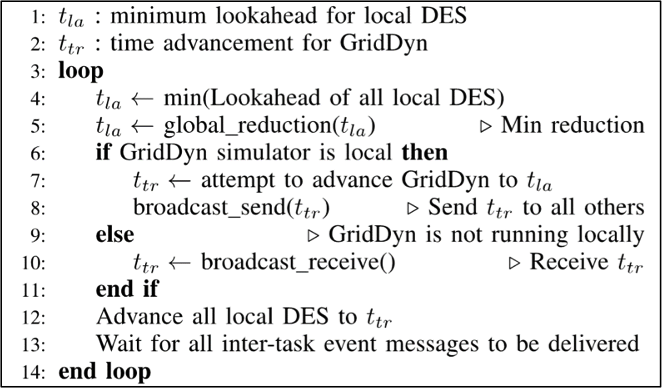
In FISKIT, we chose to initially implement a modified, conservative parallel algorithm for time advancement that emphasizes accuracy over performance. A modification to the YAWNS3 (Yet Another Windowing Network Simulator) conservative parallel synchronous algorithm was necessary because of the nature of the time advancement in GridDyn and the lack of rollback in ns-3. Specifically, through the root-finding capability, GridDyn will detect and institute an early return if a state change occurs on monitored equipment, thus requiring communication with the communication network. We want to fully utilize this capability to initiate event sequences in the coupled communications model for simulation of control systems.
The standard conservative time-advancement algorithm requires knowledge about the look-ahead for each simulator. The look-ahead is a lower-bound time under which no condition will cause an inter-federated event to occur. The minimum look-ahead for all simulators is used to advance time. With root finding, GridDyn cannot precompute a significant look-ahead. We made significant changes to the standard YAWNS algorithm to accommodate this limitation (Figure 4).
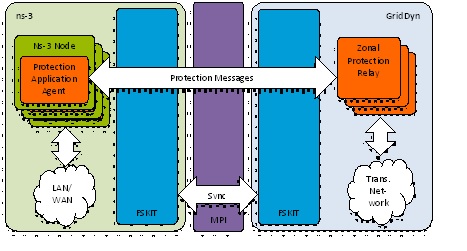
These changes ensure that temporal ordering of events is maintained at the loss of some parallelism, because GridDyn is not run in parallel with other coupled simulators (Figure 5).
Figure 5. Interfaces between the ns-3 network simulator and the GridDyn power transmission-system simulator within the federated simulation toolkit (FSKIT).
As a simple case study to demonstrate the proper functioning of our co-simulation environment, we implemented a smart-grid protection application from the literature4 and applied it to a well-known IEEE transmission test case. The communications network topology and characteristics were synthesized from the IEEE test case using a simple conversion heuristic. Zonal protection relays and fault conditions, which form the basis of the transmission system dynamics for this test case, were modeled based on common well-known designs. Communication between simulators takes the form of protection messages. In addition to serving as a baseline test case for performance evaluation of our co-simulation environment, this case study reinforces the feasibility of performing complex, smart-grid system design and analysis at the transient level with co-simulation.
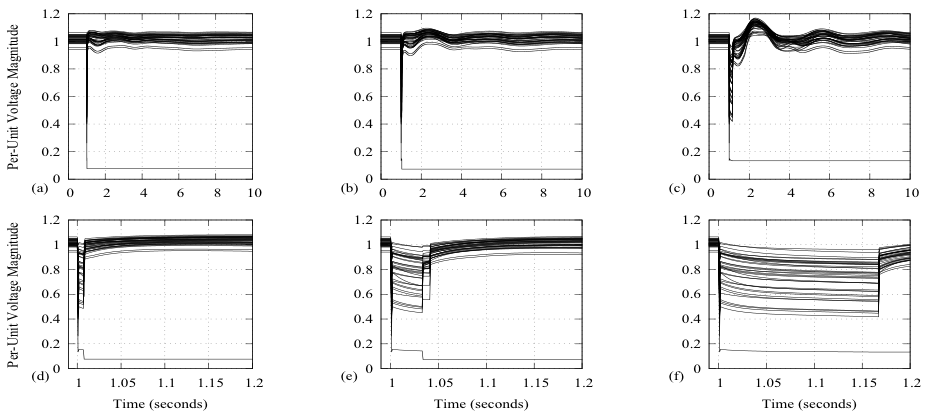
Figure 6 shows the simulation results of three different wide-area network propagation delay profiles and their effects on the voltage recovery of the 39-bus system when protected by the communication-based ad-hoc backup protection system. The three columns reflect the different wide-area network propagation delay profiles. The top row shows the voltage profile over the simulation period (0–10 s). The bottom row shows a close-up of the voltage profile during relay operation. Figure 6 (a, d) represent the base-case wide-area network propagation delay (proportional to transmission-line reactance, with a range of 44–308 s). Figure 6 (b, e) represent the base case scaled-up by a factor of 100 (4.4–30.8 ms). Figure 6 (c, f) represent the base-case scaled up by a factor of 1,000. In this case, a wait timeout occurs and relays R3;4 and R5;4 trip at 0.167 ms. As wide-area network latency increases, performance of the protection application degrades, and overall system voltage recovery suffers. This experiment demonstrates how model parameter changes in one simulator can affect behavior in other simulated systems, which allows the study of cyber-physical interactions at the transient level.
Impact on Mission
Energy security is a strategic thrust of the Laboratory in support of national priorities. Our research supports LLNL’s efforts to support the national energy system by providing novel modeling and simulation approaches suitable for advanced computational architecture to reduce major power outages and ensure energy security through an optimized electric grid, in support of the Laboratory's strategic focus area of energy and climate security.
Conclusion
We have provided the first steps in co-simulation of power system distribution, transmission, and communication. New software developed includes the GridDyn transmission system simulation, the GridLAB-D coupled transmission and distribution simulator, and the FSKIT federated simulation toolkit. Results show the effectiveness of co-simulation of distribution and transmission and of transmission and communication. Co-simulated case studies demonstrated our extensible, high-performance computing platform for performing complex smart-grid system design and analysis at the transient level. Future work will address the co-simulation of all three systems simultaneously. The scientific accomplishments from this project led to another strategic project “Development of Integrated Transmission, Distribution and Communication Models” under the DOE Grid Modernization Lab consortium initiative, a strategic partnership between DOE and the national laboratories to collaborate on modernizing the nation’s grid. Lawrence Livermore is also collaborating with Eaton and Pacific Gas and Electric to utilize the developed simulator as the test bed for their DOE Advanced Research Projects Agency-Energy project.
Commercial software vendors, researchers, and utilities will be able to build on our prototype software platform to solve problems associated with dynamic system interactions. This new capability will enable practitioners and researchers to identify not only potential reliability impacts of emerging technologies and control modes that cannot presently be fully evaluated, but also mitigation measures to ensure reliability. The current lack of such a software platform increases uncertainty not only about the viability of frequency regulation and voltage support resources, but also about emerging technologies, which could result in adverse economic, technical, and social impacts.
References
- Nutaro, J., et al., “Integrated hybrid-simulation of electric power and communications systems,” IEEE Power Engineering Society General Mtg., Tampa, FL, June 24–28, 2007.
- Hindmarsh, A. C., et al., “SUNDIALS: Suite of nonlinear and differential/algebraic equation solvers,” ACM Trans. Math. Software 31(3), 363 (2005).
- Nicol, D., C. Micheal, and P. Inouye, “Efficient aggregation of multiple LPs in distributed memory parallel simulations.” 1989 Winter Simulation Conf. Proc., p. 680. Institute of Electrical and Electronics Engineers, Inc., Piscataway, NJ (1989).
- Lin, H., et al., “GECO: Global event-driven co-simulation framework for interconnected power system and communication network,” IEEE Trans. Smart Grid 3(3), 1444 (2012).
Publications and Presentations
- Kelley, B. M., et al., A federated simulation toolkit for electric power grid and communication network co-simulation. (2013). LLNL-PRES-669522.
- Liang, M., Micro behavior information decision research in an ABM traffic and energy model. IEEE Green Technologies Conf., Denver, CO, June 4–5, 2013. LLNL-CONF-684957. http://dx.doi.org/10.1109/GreenTech.2013.87


