Jessica Osuna (14-LW-079)
Abstract
Current research of the terrestrial carbon cycle is limited by the ability to separate carbon dioxide (CO2) uptake from release at the Earth’s surface. Our research objective was to develop a sensor with the flexibility to measure atmospheric CO2 concentration in situ in ways that improve upon the measurements currently taken worldwide. We use wave modulation spectroscopy with a tunable diode laser mounted in a multi-pass White cell (a technology used in spectroscopy to observe weak spectra in gases and liquids) to measure CO2 absorption. Based on previous work, the second harmonic component of the modulated signal (2f) provides the optimal signal-to-noise ratio. In a controlled laboratory environment, the 2f signal consistently responded linearly to changes in CO2 concentration within the range of CO2 observed in a natural ecosystem. During extended laboratory testing with constant CO2 concentration flowing through the sensor, the 2f signal increased over time. We hypothesize that variation in the detector temperature is the source of change in the relationship between 2f and CO2 concentration because all other components are thermally controlled. While the offset of the 2f and CO2 relationship changes, the data indicates that the response remains linear. We deployed the sensor at a University of California, Davis’s experimental alfalfa field. As expected, the Livermore sensor indicated daily trends in CO2 concentration that agreed with the trends measured by commercially available instrumentation, with Laboratory-measured values offset compared to other instruments. We attribute this offset to the impact of environmental drivers on the detector. Our work demonstrates that wave modulation spectroscopy is a viable approach for measuring trace gases in situ. The sensor can contribute to studying the terrestrial carbon cycle by using fiber optics to operate multiple sample cells with a single laser, thus reducing the cost constraint. Additionally, because the sensor is modular, it can be adapted to multiple applications by changing the laser emission wavelengths.
Background and Research Objectives
The second most abundant greenhouse gas in the atmosphere after water vapor is CO2. Much of the uncertainty in the global carbon cycle is because of the terrestrial biosphere where photosynthesis is the dominant sink of CO2 and respiration is the dominant source.1 Estimates of the terrestrial biosphere CO2 source and sink strengths leverage information from Fluxnet, a global network of 500 towers, conducting continuous measurements of ecosystem CO2 flux. Most towers in the network, however, are only able to directly measure the net CO2 flux with a single sampling location above the ecosystem canopy. Statistical models then provide individual contributions of photosynthesis and respiration to the net flux.2 This approach is the best available currently, but is flawed due to self-correlation because photosynthesis is calculated as the difference between respiration at night and net CO2 flux, which includes respiration during the day.3
A few methods exist to improve ecosystem flux measurements. The first method is to use a profile of CO2 measurements along a gradient—that is, depth through a dense canopy allowing for, among other things, separating soil respiration from canopy respiration. Another option for separating fluxes is to measure 13CO2 fluxes. These approaches are not used widely across Fluxnet in part because of a nearly linear increase in price with instrumentation for flux profile measurements, and the large cost and power load required to acquire, run, and maintain instrumentation capable of measuring CO2 isotopologue fluxes. An isotopologue of a chemical species has at least one atom with a different number of neutrons than the parent.
Here, we explore sensor technology that would allow for the rapid sampling of CO2 in situ and lay the foundation for extending the technique to various approaches for meeting the needs of a site. This technology could be used to increase the number of sampling locations at a site without a direct linear cost increase by implanting fiber optics. Fiber optics would allow multiple sampling locations to operate off of a single laser. Additionally, the approach can be applied to targeting measurements of CO2 isotopologue fluxes passively, in situ, and with low power requirements by using a laser tuned to wavelengths where multiple CO2 isotopologues have absorption peaks.
The objective of our research was to develop a CO2 and 13CO2 sensor that could meet the specifications necessary to measure CO2 concentration in situ. We demonstrated initial testing and characterization of the sensor in the laboratory targeted at achieving the specifications necessary for measuring CO2 fluxes. We additionally determined results from field tests where the sensor was deployed at two sites alongside commercially available instruments.
Scientific Approach and Accomplishments
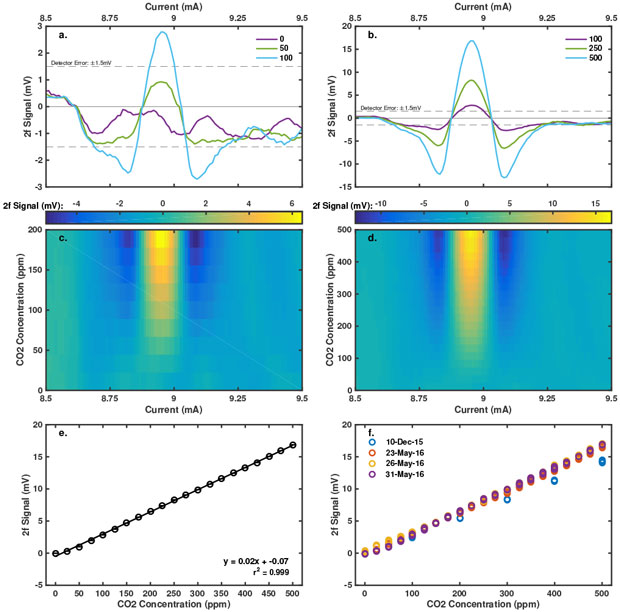
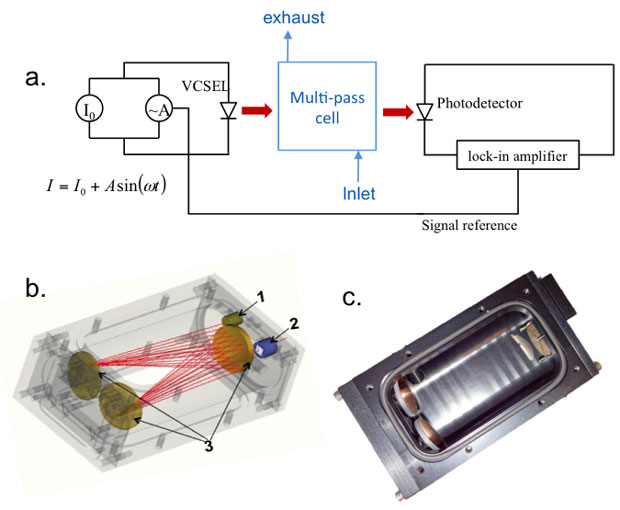
The sensor uses wave modulation spectroscopy with a vertical cavity surface-emitting laser (VCSEL, VL-2012-1-SQ-A-5, Vertilas GmbH, Garching, Germany) mounted in a multi-pass White cell (Fraunhofer, IPM., Freiburg, Germany). The White cell has an equivalent optical path length of 2.18 m over 28 passes (Figure 1) that leads to an indium-gallium arsenide detector (InGaAs DET10D/M, Thorlabs Inc., Newton, New Jersey) also mounted in a sample-cell port. An integrated thermoelectric cooler and 10-kOhm thermistor connected to a thermal controller (LDC-3722, ILX Lightwave Corp., Bozeman, Montana) maintained the VCSEL temperature at 30˚C so the laser spectra were able to capture 4 CO2 absorption peaks near 2,012 nm.4 At this temperature, a dedicated current source (Model 2602, Keithley Instruments, Inc., Cleveland Ohio) scanned from 0 mA to 10 mA in 1-µA resolution. A current–wavelength calibration with a Michelsen interferometer (721B Laser Spectrum Analysis, Bristol Instruments, Inc., Victor, New York,) demonstrated that we were targeting the intended peaks (data not shown). An alternating current source with wave frequency and amplitude of 5 kHz and 125 µA, respectively (Model 6221, Keithey Instruments, Inc.) provided signal to a lock-in amplifier (SRS-830, Stanford Research Systems, Sunnyvale, California). We used the second harmonic (2f) of the modulated wave signal based on previous work demonstrating this signal has the best signal-to-noise ratio,5 as shown in Figure 2.In the laboratory, we calibrated the strength of the 2f signal against CO2 concentration by flowing either pure carbon dioxide stock (Air Liquide America Specialty Gases, Plumsteadville, Pennsylvania) or calibrated 500-ppm CO2 balanced in air (Matheson Tri-Gas Inc, Basking Ridge, New Jersey) with an additional volume of ultrahigh-purity nitrogen (Air Liquide America Specialty Gases) through the White Cell using mass flow controllers (EL-Flow Select Series, Bronkhorst USA, Inc., Bethlehem, Pennsylvania). We used Labview software (National Instruments Corporation, Austin, texas) developed in-house to control the experiments and data acquisition. The CO2 concentration flowing through the cell was verified by directing the airflow from the sample cell to a Picarro G-1301 gas analyzer (Picarro, Inc., Santa Clara, California).
The laboratory CO2 calibrations demonstrated a linear response of 2f signal strength to CO2 concentration (Figure 2) with a very high correlation coefficient (r2 = 0.999). The limit of detection, limited by detector error of ±1.5mV, is approximately 100-ppm CO2. During the calibration, 10 scans were made at each CO2 concentration. The 2f signal had very small variability at any single CO2 concentration, as shown by the barely visible error bars in Figure 2(e). Under controlled conditions, the calibration was repeatable, as shown in Figure 2(f). On December 10, 2015 the calibration was performed on the benchtop. On the remaining days, the calibration was performed in a buffer volume.
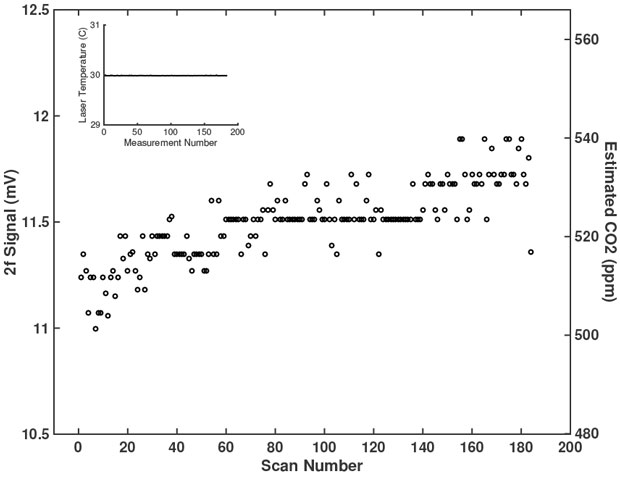
Following the 2f-CO2 calibration, we tested the stability of the sensor under constant conditions. Constant 400-ppm CO2 flowed through the sample cell while the cell was inside a buffer volume to reduce potential leakage. The 2f-CO2 calibration provided an estimated CO2 concentration in the sample cell from the peak 2f signal for each scan (Figure 3). Our calibration overestimated the CO2 concentration in the sample cell. During the approximately 6 hours of measurements, the sensor estimated a CO2 concentration from 500 ppm to 540 ppm, well above the actual concentration of 400 ppm. While the air flowing through the sample cell had a constant CO2 concentration, the estimated concentration increased over the duration of the measurements. Because the laser temperature (Figure 3, inset), CO2 concentration, and 2f-CO2 calibration constants were constant, we attribute this change in 2f strength under constant conditions to temperature variability of the detector. We did not have a temperature-controlled detector available when we did in situ testing of sensor performance.
To test sensor performance in situ, we deployed the system with the AmeriFlux Multi-Sensor Array at the University of California, Davis’s experimental alfalfa field. The AmeriFlux Management team hosts multiple standard and state-of-the-art instruments here that interest the flux community. Because some of the instruments are still in the development phase, and therefore proprietary information was involved, we were not given the company or instrument names associated with the data streams coming from the AmeriFlux instruments. However, the source of the data that we were given was an instrument that is already among those used regularly by research groups around the world.
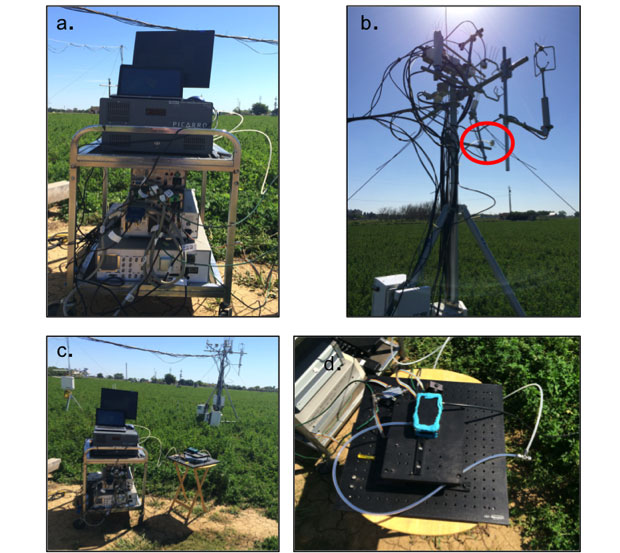
This site was ideal in part because of electrical power availability, the proximity to Livermore (to minimize sensor transport), and the array of instruments performing continuous measurements of meteorological conditions and trace gas concentration, including CO2. The Picarro and the electronics and computer, to control the LLNL sensor, were connected to line power through a surge protector, shown in Figure 4(a) and placed on a cart near the AmeriFlux flux tower, shown in Figure 4(c). The air flowed from ambient atmosphere through an inlet that was mounted on the flux tower, then through an air filter and to the LLNL sensor. The LLNL sensor sample cell was mounted on a portable optical bench and placed on a small table, shown in Figure 4(d). The blue compound seen in the figure is sealing putty (Qubit Systems, Ontario, Canada) that does not off-gas anything that would interfere with trace gas measurements. The air then flowed out of the LLNL sensor and to the Picarro. The Picarro pumps forced the air through the two sensors in series. We scanned currents that captured only the highest 2 peaks of CO2 absorption near 2,012 nm to decrease the amount of time required per scan.
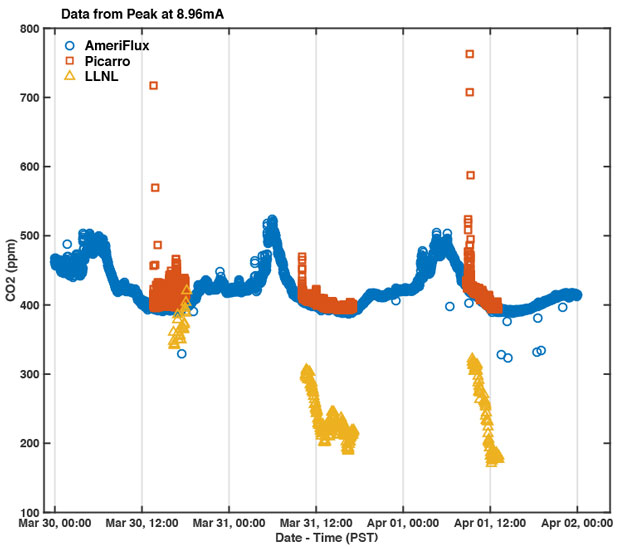
Measurements were performed over 3 days for a total of approximately 16 hours of sampling covering the mid-morning, afternoon, and early evening. Nighttime and early-morning measurements were not performed because the humidity increased during the night and could have resulted in dew formation within the instrument. During the measurements, atmospheric relative humidity ranged from approximately 25 to 80%. Air temperature ranged from 14 to 24°C. Based on the AmeriFlux instruments, CO2 concentration ranged from approximately 375 to 525 ppm.
The CO2 concentration measured with the Livermore sensor was underestimated compared to the Picarro and the AmeriFlux instrumentation. The Picarro and AmeriFlux sensors were in agreement regarding the CO2 concentration, after the initial high CO2 signal of human respiration passed through the system. On all three days of measurement, the Livermore-estimated CO2 concentration demonstrated a trend that agreed with AmeriFlux and Picarro estimates. Specifically, the Livermore-estimated CO2 decreased during the afternoon when photosynthetic uptake of CO2 is greatest, and increased in the evening when respiratory release of CO2 dominates over photosynthetic uptake.
The results of our work demonstrate that the Livermore sensor has the ability to meet the requirements for measuring trace gases in situ with a few adjustments. Unfortunately, the AmeriFlux multi-sensor array was a temporary effort and therefore we could not repeat the deployment after acquiring a thermal-controlled detector that met the noise and sensitivity requirements. However, the consistent linear response and modularity of this sensor holds great promise for many future applications.
Impact on Mission
The Livermore sensor that we developed and tested lays the foundation for further work with many applications. First, we developed a workflow for testing and characterizing a wave-modulation spectroscopy tunable diode-laser sensor in a controlled laboratory environment to determine the sensor’s ability to measure trace gas concentrations in the ambient atmosphere. We also demonstrated that this sensor could be deployed in situ and make predictable measurements of trace gas concentration. We isolated potential weaknesses in the sensor performance to produce a more stable and reliable sensor. This knowledge advances progress toward a sensor that is ready to adapt to various applications depending on program interest. The sensor can target different atmospheric trace gas species by changing the wavelengths scanned by the tunable diode laser. As such, the knowledge and capability developed during this project is valuable and positions the Laboratory to pursue a variety of applications. One such application is methane detection. Methane is a current issue because of its leakage from fracking sites. Because this sensor is small and portable, it can detect spikes in methane concentration or, using methane isotopologue measurements, separate sources of methane in a region potentially affected by methane leakage. In addition to deploying the technology at a single location, it could be deployed on an unmanned aerial vehicle. Researchers at NASA-Ames have a fleet of such vehicles that are used to detect fluxes. Our group visited NASA-Ames to understand the requirements for an unmanned aerial vehicle-mounted sensor. By converting the electronic controls to a data-acquisition platform, the sensor will have the size and power requirements appropriate to aerial deployment.
Livermore is currently applying the sensor technology to detect water vapor isotopologues. The information gained by this sensor’s measurements allows researchers to further understand the source depth and age of water transpired by an ecosystem. This information is valuable for estimating water residence times and the impact of severe drought on a watershed.
Conclusion
This objective of this project was to develop a sensor capable of measuring atmospheric CO2 concentration in situ with a tunable diode laser using wave modulation spectroscopy. In the laboratory, we demonstrated that the sensor has a linear response to CO2 concentration. The 2f-CO2 calibration was consistent in a controlled laboratory environment. With extended operation, the calibration shifted as seen by repeated measurements of a constant airflow. Based on our testing, we believe that a temperature-controlled detector will improve sensor stability during extended sampling. Additionally, we demonstrated that the Livermore sensor responded as expected to changes in CO2 concentration in situ, showing trends in CO2 concentration that agreed with commercially available instruments. The actual CO2 concentration estimated by the Livermore sensor, did not agree with other instruments, most likely because of environmental impacts on the detector. Overall, this sensor provides the foundation for further development of the technology in different directions based on application need. The Laboratory has the appropriate lasers to target water vapor, methane, and isotopologues of CO2. By integrating fiber optic connections and transitioning to a data-acquisition platform unit, this sensor has the capability to serve as a modular device for targeting various trace gases at multiple sampling locations with a single laser and detector. With the work we performed describing sensor design and performance as a basis, further work can focus on meeting the power and wavelength requirements of any particular application.
References
- Friedlingstein, P., et al., “Climate–carbon cycle feedback analysis: Results from the C4MIP model intercomparison.” Climate 19, 3337 (2006).
- Reichstein, M., et al., “On the separation of net ecosystem exchange into assimilation and ecosystem respiration: review and improved algorithm.” Global Change Biol. 11, 1424 (2005).
- Vickers D., et al., “Self-correlation between assimilation and respiration resulting from flux partitioning of eddy-covariance CO2” Agr. Forest Meteorol. 149(9), 1552 (2009).
- Rothman, L. S., et al., “The HITRAN 2012 molecular spectroscopic database.” Quan. Spectros. Radiative Tran. 130, 4 (2013).
- Bond, T., et al., Multiplexed gas spectroscopy using tunable VCELS. SPIE Defense, Security + Sensing Symp., Baltimore, MD, Apr. 23–27, 2012. LLNL-JRNL-548132.


