Ronald Baskett (14-ERD-006)
Abstract
Accidental or terrorist releases of hazardous materials into the atmosphere can impact large populations and cause significant loss of life or property damage. Two significant sources of uncertainty in the prediction of the consequences result from poorly characterized source terms and incomplete knowledge about the meteorology, yet the impact of the latter on quantifying the source term and downwind impact has largely been ignored before now. To address this need, we developed an Atmospheric Source Reconstruction capability applicable to a variety of landscapes. First, on the urban scale, we developed a computational Bayesian inverse technique (i.e. we used a probability theory that accounts for unknown factors) to quantify the effects of meteorological inflow uncertainty on tracer transport and source estimation using a robust observational data set taken during a controlled release in Oklahoma City. Second, on the regional scale, we developed ensemble simulations and machine learning algorithms, to which we applied our Bayesian inversion to estimate the most probable source parameters from California’s coastal Diablo Canyon Nuclear Power Plant (NPP). Third, for the challenging real-world Fukushima Dai-ichi NPP accident, we designed a study and built an extensive data set of ensemble forecast-dispersion model runs for further analysis. Our documented Atmospheric Source Reconstruction capability is applicable to a variety of atmospheric releases, such as from nuclear power plants, emissions from large-scale industrial accidents, volcanic plumes, and fires. Our capability has since been used by the National Atmospheric Release and Advisory Center (NARAC) to address the needs of an external sponsor.
Background and Research Objectives
NARAC's support of the March 2011 Fukushima Dai-ichi NPP accident highlighted the urgency to determine reliable source terms based on limited information.1 NNSA’s July 2011 After Action Report identified a critical research and development capability gap: the ability to assimilate large, field-measurement data sets to estimate the timing and magnitude of unknown releases. A related, critical, national need is rapid environmental characterization of contaminated regions and exposed individuals after the airborne release of biological agents.2,3,4
The Laboratory had previously developed source reconstruction methods which produced fits of unknown source locations, times, and amounts to several field data sets. The source location estimate was relatively close to the true location, but the true location was often outside the set of those considered most likely. This was because the methods used didn’t consider the uncertainty of the meteorology. A capability to determine the best fit of time-varying source rates of hazardous releases with improved uncertainty estimates has been a critical national need and the primary research objective of this research project.
Scientific Approach and Accomplishments
We built an Atmospheric Source Reconstruction (ASR) capability that includes uncertainty quantification. To do this required several steps and the incorporation of several tools.
First, we developed and documented a script-based, modeling framework code that uses an ensemble of meteorological conditions to provide a probabilistic estimate of the most likely source characteristics. We used "Aeolus CFD," a dispersion model on the urban scale, that uses computational fluid dynamics (CFD) to simulate atmospheric and tracer flow around buildings and structures at meter-scale resolution.5
Second, we used "WRF-FLEXPART" for meteorology and dispersion on the regional or mesoscale. The Weather Research and Forecasting Model (WRF) is a community meteorological forecast model supported by the National Center for Atmospheric Research (NCAR). FLEXPART is a community mesoscale dispersion model supported by the Norwegian Institute for Air Research.
Third, we leveraged a Bayesian inversion Monte Carlo sampling scheme developed at Livermore to estimate regional-scale greenhouse gas emissions.6
Fourth, we tested the framework against synthetic data (to verify the methodology and code) and two controlled-release experiments to demonstrate the real-world applicability on urban and regional scales, as detailed below.
Urban-scale test against the 2003 Oklahoma City tracer study 7
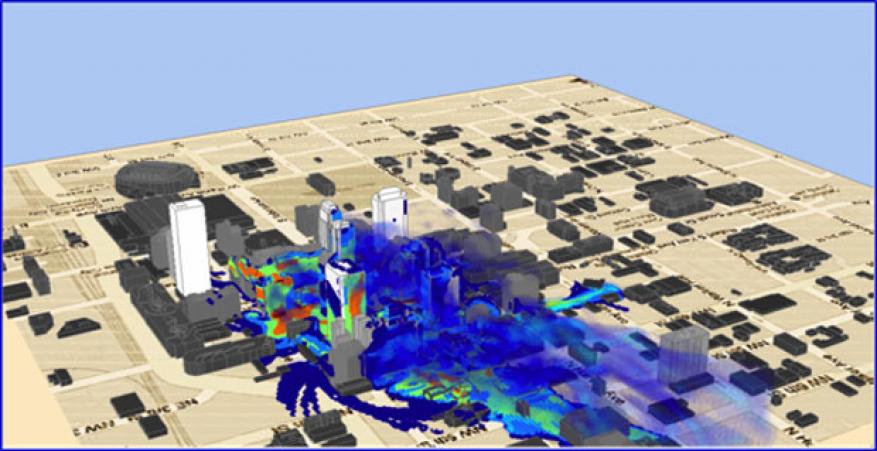
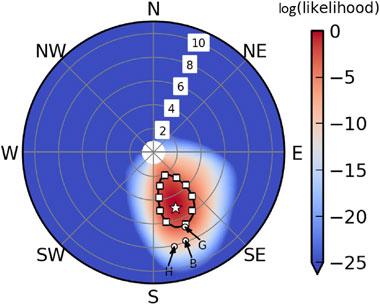
Using measurements of wind and tracer concentrations taken during the Joint Urban 2003 tracer release experiment conducted in Oklahoma City, we computed the probability density functions (PDFs) for inflow conditions for the city’s central business district using Aeolus (Figure 1), and then propagated these PDFs through the system to constrain the source location.We propagated uncertainty in the inflow forward and backward via Lagrangian dispersion calculations to determine the impact on tracer transport and the ability to estimate the release location of an unknown source. Figure 2 shows how inflow uncertainties have a pronounced effect on the estimated source locations.
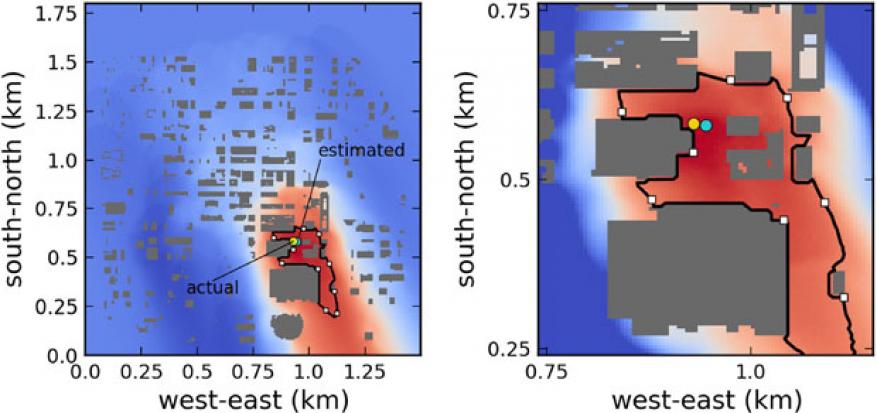
Inflow probabilities were also used to weight backward dispersion plumes and produce a spatial map of likely tracer release locations. Figure 3 shows that our best estimate of the location of the known release was within 20 m of the true release location.
Regional-scale test against the Diablo Canyon NPP tracer study
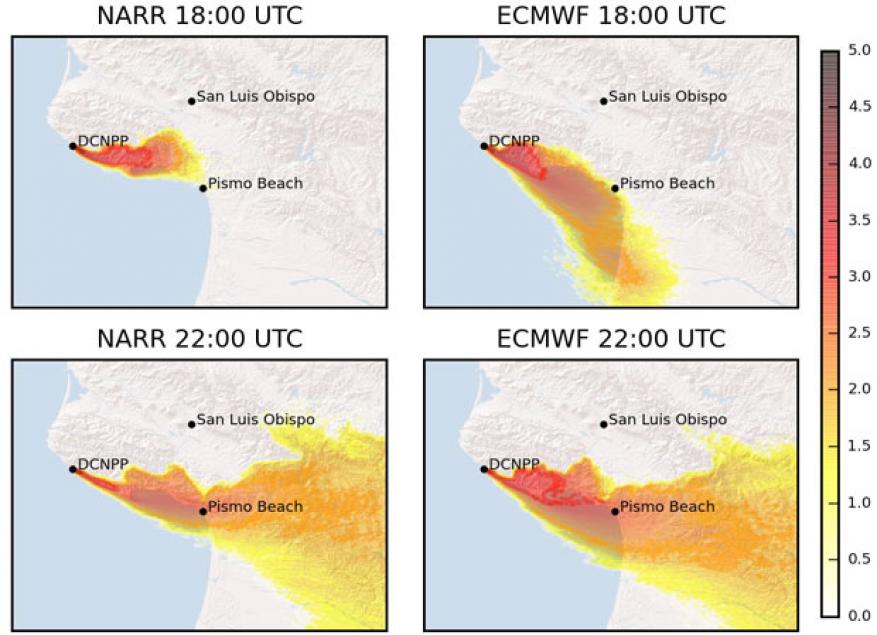
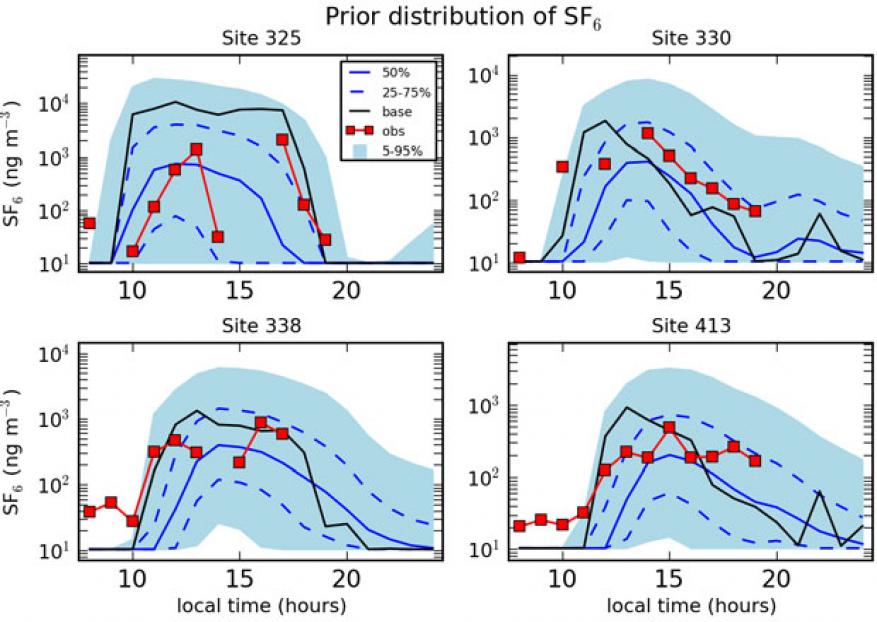
Using ensemble simulations, machine learning algorithms, and Bayesian inversion, we quantified the PDFs of model inputs that affect the transport and dispersion of the DOPPTEX gas tracer study at Pacific Gas and Electric’s Diablo Canyon NPP. We constrained the PDFs by observations of tracer concentrations and account for uncertainty in meteorology, transport, and emissions. We calculated meteorological uncertainty using an ensemble of simulations of the WRF model that samples five categories of model configuration (initialization time, boundary layer physics, land surface model, nudging options, and reanalysis data). We used the WRF output to drive tens of thousands of FLEXPART dispersion simulations that sample a uniform distribution of six emissions inputs.
We trained machine learning algorithms on the ensemble data to quantify the sources of ensemble variability and to infer, via inverse modeling, the values of the 11 model inputs most consistent with tracer measurements. We found a substantial ensemble spread in tracer concentrations (factors of 10 to 103). About 80% of the spread is due to changing emissions inputs. We verified that our inverse method determines the model input values used to generate the outputs from arbitrarily selected simulations. When applied to measurements from a controlled release experiment, our inverse method retrieved the known emissions values and provided the probabilities for different combinations of WRF inputs.
To our knowledge, this work represents the first joint inversion capability applied to FLEXPART dispersion simulations that provides PDFs of categorical inputs in WRF and continuous inputs in FLEXPART which were validated with tracer release data. Our study provides an important validation test of the inversion algorithm, because the tracer emissions are assumed to be unknown and inferred in the inversion.
Regional-scale test against the Fukushima Daiichi NPP accident
We spent considerable effort designing a data set from several sources of data collected during March 2011 Fukushima accident. After determining the limited field measurements during the first week of the event were insufficient for our source inversion study, we decided to use the quality assured deposition data set built by an international collaboration.8,9 The deposition data were extensive but collected more than 28 days after the first release. Unfortunately, a large, but little-studied release from the Fukushima power plant about 3 weeks after the initial event meant that we had to dramatically increase the length of our simulation period to cover the additional release period. We created a 162-member ensemble set of 28-day WRF runs and then 10,000 FLEXPART runs per WRF ensemble. This redesign and building of a much more massive data set exceeded our original scope of work and prevented us from completing the inversion. However, archived outputs are ready for future study.
Further accomplishments
In addition to the work described above, we also accomplished the following: (1) presented 4 conference papers; (2) published two peer-reviewed articles; (3) supported research tasks for 3 Military Academy summer students; and (4) provided data and support for the PhD research of Devin Francom, a Lawrence Scholar and graduate student in the Department of Statistics at the University of California, Santa Cruz (supervised by Bruno Sanso), who is developing new statistical methods to analyze complex spatiotemporal air dispersion patterns.
Impact on Mission
Our research is directly applicable to the monitoring, detection, analysis, and rapid response needs of multiple areas that have atmospheric components including consequence management of nuclear power plant events, nuclear nonproliferation, nuclear forensics, and greenhouse gas and air-quality emission compliance in support of central Laboratory missions in both national and energy security. Also, our Atmospheric Source Reconstruction capability is useful for estimating emissions from industrial accidents, volcanic plumes, and fires. The project is relevant to the Laboratory’s strategic science, technology, and engineering core competency in climate change and atmospheric science, which includes work on uncertainty quantification, model diagnosis and comparison, and managing large data sets for climate research as detailed in Livermore's Atmospheric Sciences Strategic Plan.
In addition, our work has already directly impacted the Global Security NARAC program in several ways:
- Our documented ASR software package is available for those who wish to reconstruct the most probable meteorology and source term inputs to match a set of associated ambient measurement data. (Available on the Atmospheric Source Inversion Confluence page)
- Our ASR software package has been successfully used in a classified NARAC assessment.
- Our Joint Urban 2003, DOPPTEX, and Fukushima tracer studies, as well as our WRF and dispersion model ensemble data sets have been documented and archived for future analyses and testing.
- We have successfully transferred knowledge to the NARAC program as the principal scientist who conducted much of the research now supports NARAC.
Conclusion
We have significantly advanced Livermore’s ability to determine unknown source characteristics from atmospheric releases by developing an enhanced Bayesian source inversion capability that includes quantifying the uncertainty of source and meteorological conditions. We tested the capability against urban and regional-scale tracer data sets and published results. We used community models and documented our capability, which provides opportunities for future collaborations. We successfully transferred knowledge and capability to the NARAC program. Finally, our tool was used for a real-world assessment by the NARAC program.
References
- Sugiyama, G., et al., "Atmospheric dispersion modeling: Challenges of the Fukushima Dai-ichi response." Health Physic. J. 102(5), 493 (2012). http://dx.doi.org./10.1097/HP.0b013e31824c7bc9
- National Research Council., BioWatch and public health surveillance: Evaluating systems for the early detection of biological threats: Abbreviated version. The National Academies Press. Washington DC (2011).
- Raber, E., et al. Interim consequence management guidance for a wide-area biological attack. (2011). LLNL-TR-484706.
- Yang, L., et al., “Wide area restoration following biological contamination,” Proc. SPIE 6945, Optics and Photonics in Global Homeland Security IV, 69450I. (2008). http://dx.doi.org/10.1117/12.782226
- Gowardhan, A. A., et al., “A CFD based wind solver for a fast response dispersion model,” Environ Fluid Mech. 11(5), 439 (2011). http://dx.doi.org/10.1007/s10652-011-9211-6
- Lucas, D. D., et al. “Designing optimal greenhouse gas observing networks that consider performance and cost.” Geosci. Instrum. Meth. Data System. 4, 121 (2015). LLNL-JRNL-659224.
- Lucas, D. D., et al., “Impact of meteorological inflow uncertainty on tracer transport and source estimation in urban atmospheres.” Atmos. Environ. 143, 120 (2016). LLNL-JRNL-676479. http://dx.doi.org/10.1016/j.atmosenv.2016.08.019
- Draxler, R., et al., “World Meteorological Organization’s model simulations of the radionuclide dispersion and deposition from the Fukushima Daiichi nuclear power plant accident.” J. Environ. Radioact. 139, 172 (2015). http://dx.doi.org/10.1016/j.jenvrad.2013.09.014
- Arnold, D., et al., "Influence of the meteorological input on the atmospheric transport modelling with FLEXPART of radionuclides from the Fukushima Daiichi nuclear accident." J. Environ. Radioact. 139, 212 (2015).
Publications and Presentations
- Baskett, R. L, et al., Estimating plume dispersion at PG&E’s Diablo Canyon nuclear power plant with WRF-FLEXPART. Meteorology and Climate—Modeling for Air Quality, Sacramento, CA, Sept. 16–18, 2015. LLNL-POST-677256.
- Lucas, D. D., et al., Atmospheric source estimation with uncertainty quantification for urban scales. 18th Ann. Conf. Atmospheric Transport and Dispersion Modeling, George Mason University, Fairfax, VA, June 24, 2014. LLNL-PRES-656016.
- Lucas, D. D., et al. “Designing optimal greenhouse gas observing networks that consider performance and cost.” Geosci. Instrum. Meth. Data Syst. 4, 121 (2015). LLNL-JRNL-659224.
- Lucas, D. D., et al., Meteorological uncertainty on source estimation in complex coastal terrain. 19th Ann. Conf. Atmospheric Transport and Dispersion Modeling, George Mason University, Fairfax, VA, June 9, 2015. LLNL-PRES-672178.
- Lucas, D. D., et al., “Impact of meteorological inflow uncertainty on tracer transport and source estimation in urban atmospheres.” Atmos. Environ. 143, 120 (2016). LLNL-JRNL-676479. http://dx.doi.org./10.1016/j.atmosenv.2016.08.019
- Simpson, M., et al., Impact of meteorological uncertainty on dispersion predictions in complex terrain. American Meteorological Soc. Annual Mtg., New Orleans, LA, Jan. 2016. LLNL-PRES-680782.


