Mihail Bora (16-FS-040)
Abstract
During this feasibility study we demonstrated bacterial lysis (cell disintegration) using a laser emitting at 2.94 micrometers. The laser approach can disrupt approximately 30% of cellular material as measured by optical density and total protein content assay. Analysis of total DNA release showed 11% release as measured by absorbance spectroscopy with a high degree of fragmentation that is comparable to ultrasonication. It was found that the laser treatment degrades enzymatic activity of horseradish peroxidase.
Background and Research Objectives
For this study, we aimed to demonstrate feasibility for a new technique of cellular lysis based on irradiation with infrared laser. We began by acquiring a 40W Er:Yag laser emitting at 2.94 microns, corresponding to the strongest absorption band of water, penetration depth less than 1 micrometer. The initial goal of the project was to compare the laser lysis method to a standard approach like ultrasonication and to show that it performs better than 20% compared to the reference method as measured by any relevant metric: optical density or total protein content released in the supernatant. An optical approach is particularly suitable because light can be focused in small volumes of size compared to its wavelength. Infrared light targets water absorption bands with a penetration depth on the order of 1 to 100 μm.
Scientific Approach and Accomplishments
During the initial stage of the study we purchased and characterized an Er:YAG laser (Pantec Medical) and converted it from a class IV to a class I by enclosing it with an interlock box that prevents laser operation when the box lid is open. We needed to perform this work to insure worker safety and to allow operation in a biological laboratory with only minor modifications to safety procedures. The laser emits at 2,940 nm in pulsed mode with pulse length varying from 100 to 1,000 µs and repetition rate varying from 1 Hz to 1 kHz. Laser characterization data is presented in Figure 1.The initial set of experiments were directed towards lysing one of the most common organisms, E. coli, K12 strain, such that most of the work can be performed in a biosafety level 1 setting, the lowest level. The culture samples were collected, centrifuged, and re-suspended in phosphate buffer saline solution and the optical density of the sample was adjusted to be approximately one. After transfer in an infrared transparent cuvette, the sample was placed into the optical beam path of the laser at different exposure parameters. For some experiments, we recorded the temperature with an immersion probe to account for the total dissipated energy in the sample and to perform control experiments for which the average temperature increase does not exceed 10oC. The laser lysis protocol consisted of repeated steps of laser exposure for 10 s, measurement of the optical density in a spectrophotometer, immersion in an ice bath for 1 minute, and wiping and nitrogen drying of the outer walls of the cuvette to prevent residual water films and moisture condensation.
For experiments in which the sample was not cooled in between laser exposure steps, we noticed a sample temperature increase from room temperature (20oC) to approximately 60oC, after which the quartz container cracked and the experiment was halted. This finding suggests that thermocavitation in hot fluid may generate significantly more mechanical energy as a smaller fraction is expended on heating to vaporization temperature (cavitation is the formation of vapor cavities in a liquid, such as bubbles, that usually occurs when a liquid is subjected to rapid changes of pressure). An efficient focusing mechanism may make this technique suitable for lysing difficult organisms such as bacterial spores.
Laser lysis was tested in microfluidic environments using quartz capillaries (Sutter instrument) of 300 microns inner diameter. The motivation for these experiments is a more efficient propagation of pressure waves in the one-dimensional capillary environment compared to amplitude decrease as the inverse of the distance square for cuvette experiments. The flow cell was fabricated by using heat shrink tubing (Zeus Plastics) to seal one end of the capillary to a Tygon tube connected to a syringe pump or to collection tubing. In these experiments we noticed an increase in temperature although we could not get a good readout due to small sample size. Capillary alignment in the laser beam was done with ~1mm uncertainty with a heat sensitive card. Processed sample volume was at least 1 ml such that the output could be analyzed in a spectrophotometer. The best results were obtained for flow rate 100 µl/min and showed a decrease in optical density at 600 nm from 1.015 to 0.58 (relative decrease 42%) (Figure 2).
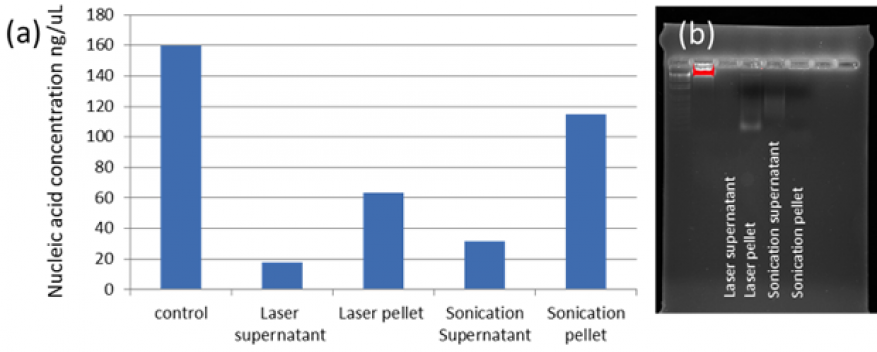
Experiments assessing the impact on DNA extraction of the laser-based lysis were performed using a DNA extraction kit (Thermo Fischer, Purelink). The control experiments were run following the kit protocol. The other samples were prepared following the gram-negative genomic DNA extraction protocol with the exception of the lysis step that was replaced by laser lysis or ultrasonication and labeled accordingly. Following the elution (extraction) step, 35 µl of concentrated DNA was collected and 10 µl were loaded onto a 2% agarose gel in tris-acetate-EDTA buffer. The samples were run at 90 V bias for 30 minutes. Results indicate that the lysis step was approximately 11% as efficient as the control and less effective compared to ultrasonication (due to a smaller fraction of the cells being lysed, see Figure 3). The nucleic acid concentration was measured in each sample with a NanoDrop spectrophotometer (Thermo Fischer). The electrophoresis gel indicates a high degree of DNA fragmentation during laser lysis, comparable to ultrasonication treatment (Figure 3b).
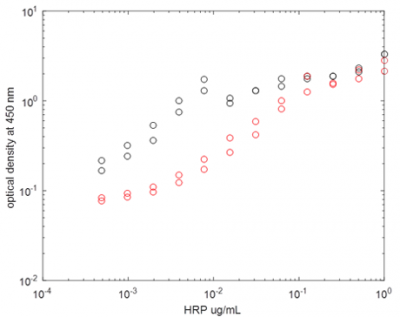
Impact of laser cavitation on enzymatic activity was tested on horseradish peroxidase enzyme conjugated with goat anti-Rat IgG antibody (Thermo Scientific, catalog number 31471). A 3-ml stock solution of 1 µl/ml was prepared and exposed to laser treatment for a total of 600 s, in 10-s increment steps. After each step, the cuvette was cooled on ice for 1 minute to avoid large increases in temperature and blow dried to avoid residual water films on cuvette surface. A series of 12 dilutions 1:2 were prepared on a 96 well plate, with 50 µl of hydrogen peroxidase sample added to each well. In each well a 60 µl-volume of tetra-methyl-benzidine peroxidase substrate was added (SureBlue Reserve, KPL Inc, Gaithersburg MD), and incubated for 5 minutes, after which the reaction was stopped with 60 µl of 0.1N HCl solution. Absorbance at 450 nm was measured as an indication of enzymatic activity (Figure 4).
Although the decrease in enzymatic activity will make other assays ineffective following laser lysis treatment, it is important to note that the method is not currently optimized and it is possible to deliver a smaller amount of energy to the sample such that transient thermal spikes are minimized.
Impact on Mission
The feasibility study added a new capability to the Laboratory of fast, reagent-less, non-contact cellular lysis that can impact other areas of Livermore’s core competency in bioscience and bioengineering, such as the critical step for sample preparation in early warning and identification of biological threats. A joint proposal with Edgewood Chemical and Biological Center has been submitted to the Defense Threat Reduction Agency for using the technique in mass spectrometry bio-threat identification assays. Another proposal has been submitted to the Office of Naval Research on multiscale testing of cavitation effects on soft materials like polymers, lipid membranes, and cells.
Conclusion
Experiments done during this feasibility study showed that it is possible to lyse cellular cultures using an infrared laser as evidenced by decrease in optical density at 600 nm during laser exposure. This finding is confirmed by measuring the supernatant protein showing that protein concentration is proportional to the relative decrease in optical density at 600 nm. Additional experiments show DNA is released in relatively small quantities and short fragments as indicated by electrophoresis.
Although the study addressed only testing large samples (~ml), the lysis method is suitable for selective lysis of single cells in microfluidic chips or integrated with flow cytometry instrumentation. High-speed imaging experiments are needed to understand the contribution of temperature increase or shock wave formation from bubble collapse on cell wall disruption and how these effects can be decoupled. Additional research is recommended on different illumination schemes like ring focus, or hundreds-of-MHz beam modulation for generating short wavelength ultrasonic waves to create high-pressure gradients across single cells (Figure 5).


