Jonathan Allen (15-ERD-023)
Abstract
Accurate identification of antibiotic resistance in microbial pathogens is critical for improved treatment of infectious bacterial agents. Access to precise diagnostic techniques to identify these pathogens would enable development of more targeted treatment protocols that retain more commensal organisms and reduce the potential for emergence of persistent antibiotic-resistant microbial strains. Our project developed new computational tools to predict and identify genes that confer antibiotic resistance using machine-learning-based protein-sequence classifiers and searchable de Bruijn gene graphs. Our results show how the use of variable-length k-mer matching (a method for exploring the variability of genetic mutation rates) and protein motifs can be used to improve the accuracy of the prediction of antibiotic resistance in complex metagenomic samples.
Background and Research Objectives
Antibiotics are often applied proactively to prevent infection with antibiotic-resistant pathogens recognized retrospectively through the identification of a persistent infection. Selective pressure on microbial communities and ongoing use of antibiotics means the resistance mechanisms of microbes evolve over time, requiring genetic-detection assays to be updated regularly. A vast number of microbial genes and genomes with resistance profiles are now being sequenced, which enables identification of key genetic features associated with antibiotic resistance. However, for any newly sequenced sample, accurately prioritizing effective antibiotic use remains a fundamental challenge. The problem is further compounded when attempting to survey a biological sample using metagenomic sequencing in combination with whole-genome sequencing. Metagenomic sequencing has the potential to reduce sample bias by recovering the genomes of organisms that fail to grow in culture. Moreover, the time it takes to recover genetic information is dramatically reduced, resulting in clinically relevant response times to aid in treatment decisions. A limitation of metagenomic sequencing is the high cost of sequencing a sufficient quantity of genomic material to capture the biologically relevant organisms. Although this cost continues to decrease, it is still too expensive to do metagenomic sequencing on a routine basis. Moreover, the data obtained presents the additional challenge of yielding only short genetic fragments (on the order of a few hundred nucleotides) that must be pieced together to reconstruct the target gene or genome. Nevertheless, metagenomic sequencing is already being used in certain clinical applications where it is more cost effective to detect “everything” simultaneously, rather than serially screening for targets until a pathogen of interest is found (Abril et al. 2016). Thus, new tools are needed to characterize these complex datasets.
The limitation of traditional sequence-alignment-based techniques for detecting antibiotic resistance is their inability to evaluate the important role of genetic variants in the development of the resistance function of a gene. The current state-of-the-art tool is ResFams, a curated database of protein families and associated hidden Markov models (HMMs) that are confirmed for antibiotic-resistance function and organized by ontology (Gibson et al. 2015). While there have been recent efforts to annotate individual gene reads with HMMs (Boulund et al. 2012), currently each read must be examined independently, which limits the ability to evaluate the potential for antibiotic resistance over the length of the gene. Other methods, such as the Comprehensive Antibiotic Resistance Database (CARD) Resistance Gene Identifier (RGI) (Jia et al. 2017), identify genes that bestow antibiotic resistance using a sequence-similarity search; however, they require that the query input be complete gene reads, not short reads. Another approach extracts sequence patterns across the entire genome, but this method requires a large training set of positive and negative examples, and may not detect resistance in novel pathogens (Davis et al. 2016). The approach that is closest in its similarity to the one used in our study uses amino-acid signatures and is implemented in the Short, Better Representative Extract Dataset program (ShortBRED) for protein filing (Kaminski et al. 2015). The limitation of this approach is the requirement that the resulting resistance signatures must be contained in a single contiguous sequence, which could limit detection sensitivity and make it difficult to attribute resistance to specific genes.
The objective of our project was to determine if the use of two new computational approaches could improve the ability of biological-threat-detection software tools to recognize and accurately identify genes that bestow antibiotic resistance, and to serve as a basis for improving future genome-based software tools. We conducted tests to evaluate the ability to detect these genes in metagenomic samples and profiles of genomes that bestow antibiotic resistance. Our results indicated that a newly developed de Bruijn graph can be used to scan the unassembled short-read metagenomic sequence data to predict the potential for antibiotic resistance in a complex metagenomic sample. In addition, the use of a newly designed amino-acid-motif construct can be used to improve the accuracy of the process of determining the potential for antibiotic resistance within a pathogen species that contains both resistant and non-resistant genetically similar subtypes. Our results indicate that use of a combination of gene graphs and amino-acid motifs improves the accuracy of detecting antibiotic resistance in complex biological samples.
Scientific Approach and Accomplishments
We investigated two new complementary computational tools to determine their potential to improve the current state of gene detection and genome profiling for antibiotic resistance. One such effort was designed to evaluate a de Bruijn graph for its use as an efficient tool to screen short metagenomic reads to detect genes that bestow antibiotic resistance. Initially, we hypothesized that a graph-based data structure would be better suited to encoding the shared relationships between genes and to represent genomic positional relationships to discriminate more precisely between similar genes with more sensitive search keys than has been done in the past with approaches based on all possible gene subsequences (of length k) from a gene-sequencing read (i.e., k-mers) (Ames et al. 2015). Figure 1 is a de Bruijn graph depicting a series of hypothetical gene sequences. The ACTG-to-CTGA-to-TGAT path reconstructs the sequence ACTGAT with vertices in the graph representing length-4 k-mers.
While the conserved relationships encoded in the graph were not exploited in this project, the positional information of the graph was used to investigate the potential to track exact matches between a query sequence and the reference genes using a variable length k. This strategy combines the sensitivity available when matching with shorter length k and the precision from recognizing and favoring longer contiguous matches where possible. The two approaches were tested for their ability to recover antibiotic-resistance gene types using positional information for a fixed-length k and variable length k. Both methods build a searchable de Bruijn graph based on the same gene database: v1.8.3 of the Comprehensive Antibiotic Resistance Database (CARD).
In the first approach, the query is a collection of short reads matched to vertices in the graph. Query reads are initially filtered by requiring that at least 25 percent of the k-mers in the read match with vertices in the graph. The k-mer match profile is constructed for each gene in the graph, measuring the number of k-mers that match between the query read and the gene. This builds a match profile for each gene, measuring the fraction of the gene with matching k-mers (breadth of match) and the number of reads matched to each gene (depth of match). The variable-length k-mer-matching algorithm goes one step further by enumerating each nucleotide in the reference gene and tracking the longest matching k-mer overlapping each position in the gene. A normalized weighted sum is computed by assigning the length of the longest matching k-mer at each gene position as the positional match weight. This scoring scheme is intended to favor fewer matches with longer k lengths over multiple matches with shorter k lengths, which are subject to random matches.
The second approach examines the use of amino-acid sequence motifs to determine whether they can be used to enhance existing detection of antibiotic-resistance genes. The constituent genes from the CARD database are converted into fifteen different alphabets. Fourteen of the alphabets are derived from the amino acid sequences and encode properties of the amino acids, such as hydrophilic or hydrophobic properties. The fifteenth alphabet represents structural features and tracks whether the amino acid is on the surface or inside of the protein structure. The genes are converted into “AR motifs,” which are contiguous k-mers for each of the fifteen alphabets, with k set to seven. Each gene in CARD is associated with a drug-resistance category description following the Antibiotic Resistance Ontology (ARO) defined by CARD. ARO is a controlled vocabulary for describing antimicrobial molecules and their targets. The genes are partitioned into thirty-five distinct ARO categories, and two classifier types (AdaBoost and RandomForest) are built from the labeled training set to classify a gene based on the presence or absence of the observed AR motif pattern. To accelerate the process of detecting possible new antibiotic-resistance genes for further detailed motif-based evaluation, query genes are matched with sequence alignment to the CARD database to identify the closest matching gene and the associated matched AR motifs using the CD-HIT program (which is used for clustering and comparing protein or nucleotide sequences) (Fu et al. 2012).
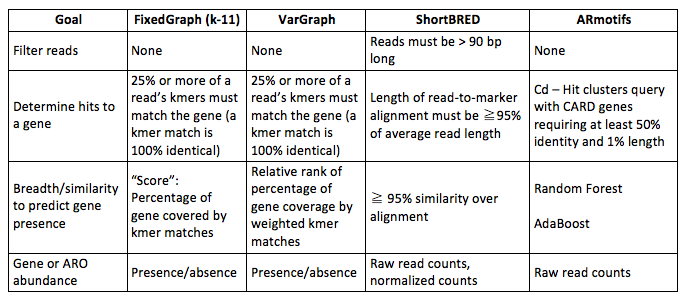
The two new computational tools were compared to three other existing tools to consider the relative strengths and weaknesses of their respective approaches. Table 1 lists the test results for the five different methods.
The test data is from the PATRIC database (Antonopoulos et al. 2017) and used a selection of pathogen genomes that are evenly divided between isolates that have been experimentally tested for their susceptibility or resistance to specific antibiotics. Table 1 is a summary of the test results for the different methods using the following formula: (prRes - prSus)/(prRes + press), where prRes is the percentage of antibiotic-resistance genes predicted in resistant genomes, and prSus is the percentage of antibiotic-resistance genes predicted in susceptible genomes. Positive values indicate an enrichment for resistance-predicted genes in resistant genomes. The results show that the AR Motif (ARmo) and CARD-RGI method (CARD) displayed the greatest discriminative value, with ResFams predicting roughly equal numbers of resistant genes in both genome types. The AR motif was tested both on whole-genome data and metagenomic data; however, in its current implementation, the software is not intended to scale to large metagenomic datasets. The AR motif tool was compared with the other methods designed to make gene-based prediction of antibiotic resistance: CARD-RGI, ResFam and CD-HIT. CARD-RGI combines detection of mutations conferring antibiotic resistance with a protein-based search (using the BLAST protein-sequencing program) of the CARD database to make a gene-based prediction. CD-HIT (CdHt) is used to do gene-based identifications by clustering the query gene with the most similar reference gene. ResFam is a hidden Markov model tool that models antibiotic resistance gene families. Both versions of ResFams are considered: core (RFco) and full (RFfu), which represent a strict and permissive prediction criterion, respectively. They are designed to balance detection sensitivity with precision. For comparison, a mapping between database resistance-category labels was created by classifying every source dataset using every evaluated method and model (e.g., ResFam predictions on a CARD dataset vs. CARD predictions on a CARD dataset). The pairwise correlation between annotation labels constrained by labels for sequences present in two source datasets was constructed.
Figure 2 depicts the breakdown of the fraction of resistance genes predicted in each genome and suggest the use of approximately 0.35 percent as a threshold to differentiate the antibiotic-susceptible and antibiotic-resistant genomes from each other.
The next set of experiments evaluated the potential to accurately report the classes of antibiotic-resistance genes present in a metagenomic sample using ARO terms. A collection of 500 simulated metagenomic datasets was assembled using a human microbiome metagenomic sample as background; it was previously screened for the absence of genes for antibiotic resistance and taken from non-diseased human samples (Human Microbiome Project Consortium 2012). Genes not included in the CARD database, but taken from a separate database of genes for antibiotic resistance, ResFinder (Zankari et al. 2012), were used for testing. Each of the five hundred samples were mixtures of seven to thirty-five genes drawn equally from fifteen ResFinder antibiotic-resistance categories and spiked in from 1–30x coverage using a power law distribution to model fewer genes at higher abundance. There are four distinct thresholds that can be tuned to address antibiotic-resistance-gene calling. They are listed in Table 2 with the settings applied for the methods compared, the de Bruijn graph using fixed length k (FixedGraph), variable-length k (VarGraph), signature peptides (ShortBRED), and AR motifs.
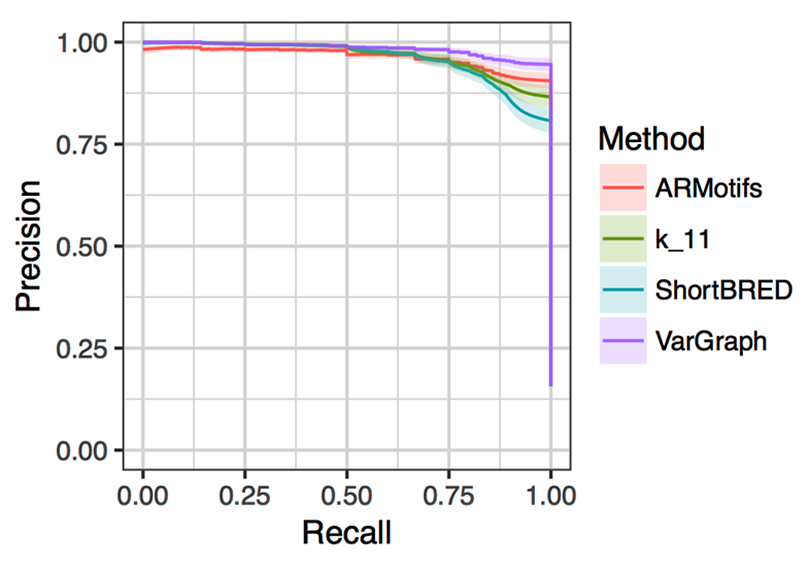
Each of the programs were run on the five hundred samples to measure their ability to correctly report one of the nineteen high-level antibiotic-resistance categories provided by CARD. Figure 3 shows a precision/recall curve for the different methods, adjusting a single threshold for each method while keeping the other variable thresholds fixed to default values. The average performance of each method is shown with the 95-percent confidence interval shaded.
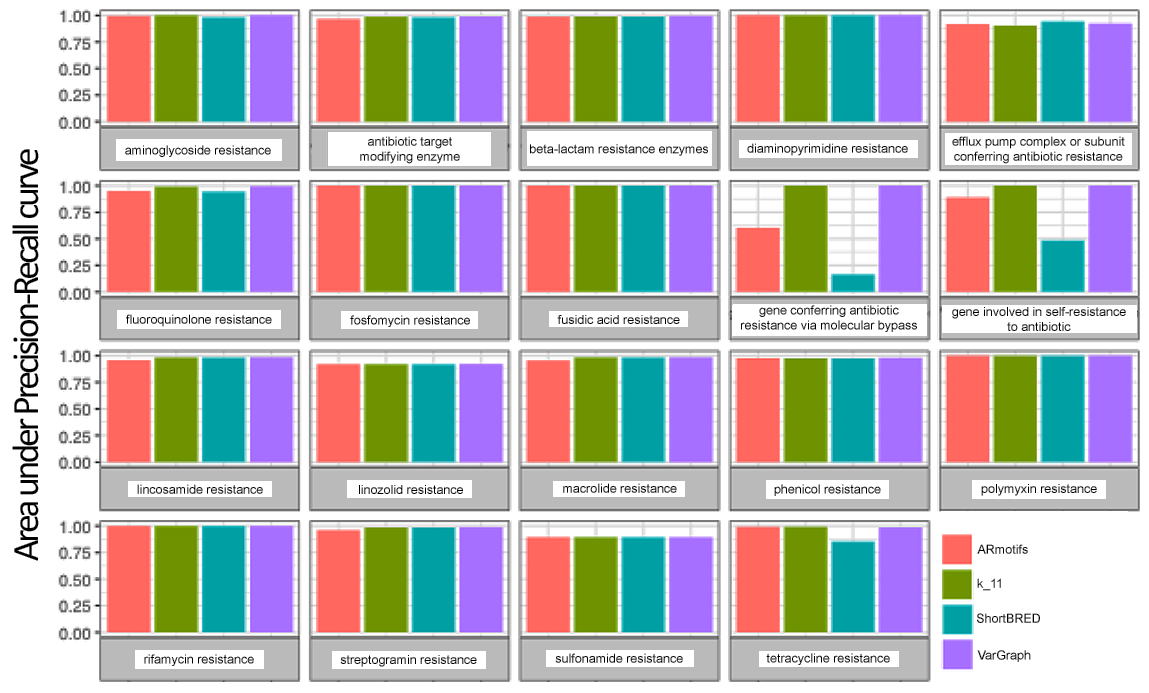
Figure 4 depicts the relative accuracies of the different classification methods grouped by resistance categories. As expected, general resistance categories, such as “gene involved in self-resistance to antibiotic,” show poorer performance and are likely attributable to the fact that a specific gene mechanism may not be uniquely associated with broad category types.
Impact on Mission
The project has developed a suite of computation-based antibiotic-resistance predictive tools currently available to support characterization of the antibiotic resistance of emerging and new biological threats. The tools are available to be used with both short-read metagenomic data and whole-genome sequences. The development of these tools anticipates the need to address technical challenges associated with functional characterization of new biological threats. It is expected that these tools will be used to support future biosecurity-related projects at the Lawrence Livermore National Laboratory.
Conclusion
The tools will be incorporated into existing operational tools used for biological-threat characterization. The tools provide additional collaboration opportunities in the design of clinical diagnostic techniques for detecting antibiotic-resistant pathogen species.
References
Abril, M. K., et al. 2016. “Diagnosis of Capnocytophaga canimorsus Sepsis by Whole-Genome Next-Generation Sequencing.” Open Forum Infectious Diseases 3 (3). doi: 10.1093/ofid/ofw144.
Ames, S. K., et al. 2015. “Using Populations of Human and Microbial Genomes for Organism Detection in Metagenomes.” Genome Research 25 (7):1056–67. doi: 10.1101/gr.184879.114.
Antonopoulos, D. A., et al. 2017. “PATRIC as a Unique Resource for Studying Antimicrobial Resistance.” Briefings in Bioinformatics. . https://doi.org/10.1093/bib/bbx083.
Boulund, F., et al. 2012. “A Novel Method to Discover Fluoroquinolone Antibiotic Resistance (Qnr) Genes in Fragmented Nucleotide Sequences.” BMC Genomics 13 (695). doi: 10.1186/1471-2164-13-695.
Human Microbiome Project Consortium. 2012. “Structure, Function and Diversity of the Healthy Human Microbiome.” Nature 486: 207–214. doi: 10.1038/nature11234.
Davis, J. J., et al. 2016. “Antimicrobial Resistance Prediction in PATRIC and RAST.” Scientific Reports 6 (June). doi: 10.1038/srep27930.
Fu, L., et al. 2012. “CD-HIT: Accelerated for Clustering the Next-Generation Sequencing Data.” Bioinformatics 28 (23):3150–52. doi: 10.1093/bioinformatics/bts565.
Gibson, M. K., et al. 2015. “Improved Annotation of Antibiotic Resistance Determinants Reveals Microbial Resistomes Cluster by Ecology.” ISME Journal 9 (1):207–216. doi: 10.1038/ismej.2014.106.
Jia, B., et al. 2017. “CARD 2017: Expansion and Model-Centric Curation of the Comprehensive Antibiotic Resistance Database.” Nucleic Acids Research 45 (D1):D566–573. doi: 10.1093/nar/gkw1004.
Kaminski, J., et al. 2015. “High-Specificity Targeted Functional Profiling in Microbial Communities with ShortBRED.” PLoS Computational Biology 11 (12):1–22. doi: 10.1371/journal.pcbi.1004557.
Zankari, E., et al. 2012. “Identification of Acquired Antimicrobial Resistance Genes.” Journal of Antimicrobial Chemotherapy 67 (11):2640–2644. doi: 10.1093/jac/dks261.
Publications and Presentations
Allen, L. E. 2015. “A Microbial Genome Population Graph Annotated with Protein Structure Data to Predict Antibiotic Resistance.” Biodefense ASM, February 11, 2015. Washington, D.C. LLNL-POST-681673.
——— 2017. “Gene Population Graphs Detect Antibiotic Resistance in Metagenomic Samples.” Bacillus ACT 2017, October 1–5, 2017. Victoria, Canada. LLNL-PRES-739323.
Be, N. A., et al. 2017. “Whole Metagenome Profiles of Particulates Collected from the International Space Station.” Microbiome 5 (81). doi: 10.1186/s40168-017-0292-4. LLNL-JRNL-719082.


