Benjamin Santer (13-ERD-032)
Abstract
We developed a rigorous, scientifically credible strategy for selecting models for use in climate change detection and attribution. This required estimates of climate response to external forcing "footprints" such as atmospheric trace gases, and climate “noise” for each model, both of which were derived from archives containing output from two to three dozen models. Despite the importance of an accurate picture of noise, little work had been done to investigate the ability of different models to simulate observed spatial and temporal variability. We therefore investigated the sensitivity of detection and attribution results to model capability. To this end, we developed novel measures of model performance, with an emphasis on metrics for spatial and temporal variability, feature identification and tracking, and multiscale analysis. The codes we developed are freely available to the wider community. Our work leveraged the Laboratory’s proven capabilities in climate change detection and attribution and in developing and applying climate model performance metrics.
Background and Research Objectives
The field of climate change detection and attribution seeks to answer a basic question of great societal importance: are human activities causing climate change? To address this question, we searched for the characteristic climate response to external forcing (the fingerprint) against the background of natural climate variability (the noise). Credible detection and attribution studies require credible models to estimate both the fingerprint and the noise background.
The Program for Climate Model Diagnosis and Intercomparison at LLNL provides easy access to the simulation output from over 30 different climate models. The use of multiple, independently developed models helps to quantify signal and noise uncertainties, and to identify results that are both robust across a range of different models and interpretable in terms of basic physical mechanisms. Such robustness and traceability to physical understanding enhances confidence in the reliability of detection and attribution results.
Large multiple-model ensembles also provide opportunities for exploring the impact of model quality on detection and attribution findings. Clearly, some models are a better fit for this purpose than others. Can we identify and select climate models that are credible tools for use in detection and attribution studies? And can we identify robust physical processes, even in the presence of model errors and biases? We summarize below our main research objectives for this project.
New Metrics for Model Selection
Model errors are complex and depend on both spatial and temporal scales and the climate variable being considered. No single metric can capture all aspects of model performance. Scientifically defensible metrics must fit the purpose. They must be relevant to the scales, variables, and processes important to the problem. One goal of this project was to create a framework for model evaluation that is robust, flexible, and can lead to the selection of relevant, rigorous metrics of model quality.
New Methods to Identify Robust Physical Processes
Climate models are not black boxes—they incorporate our best understanding of the underlying physical processes that drive the coupled atmosphere–ocean–sea ice system and contribute to climate change. Many fingerprints are not simply emergent properties of the multiple-model ensemble, but are robust expectations based on well-understood atmospheric physics and radiative transfer. An example is the cooling of the stratosphere, which is the direct radiative response to anthropogenic increases in carbon dioxide and depletion of stratospheric ozone. Knowledge of these expected signals is helpful in constructing robust fingerprints that are present in all credible models, even in the presence of underlying errors or biases in the models. We aimed to identify robust, physically interpretable fingerprints, to perform detection and attribution analyses with these fingerprints, and to assess the sensitivity of results to known model errors.
Contributions to Our Understanding of Historical, Current, and Future Climate Change
Until recently, most detection and attribution studies tended to focus on variables related to surface temperature, atmospheric temperature, and ocean heat content. One goal of our work was to extend formal detection and attribution studies to largely neglected aspects of the hydrological cycle, such as zonal-mean rainfall over land and ocean or various properties of cloud cover. The scientific question of interest is whether results are internally and physically consistent across a range of different, independently monitored climate variables.
Scientific Approach and Accomplishments
New Methods for Comparing Models and Observations
Using techniques developed for image processing, we created a scale-space framework for analyzing climate model output and observational data at multiple spatial scales where different physical processes are expected to dominate. We showed that a state-of-the-art climate model with ultrahigh horizontal resolution does not invariably perform better at large scales than a model with coarser resolution.1
Detection and Attribution of Anthropogenic Changes in Global Rainfall Patterns
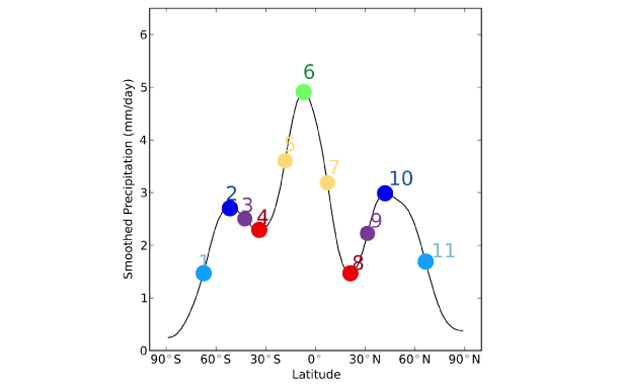
Climate models contain errors in the location and intensity of major precipitation features. However, any credible, physically based model should display the same large-scale pattern: high rainfall over the tropics, low rainfall in the subtropical desert regions, and precipitation peaks in the mid-latitudes associated with storm tracks (Figure 1).
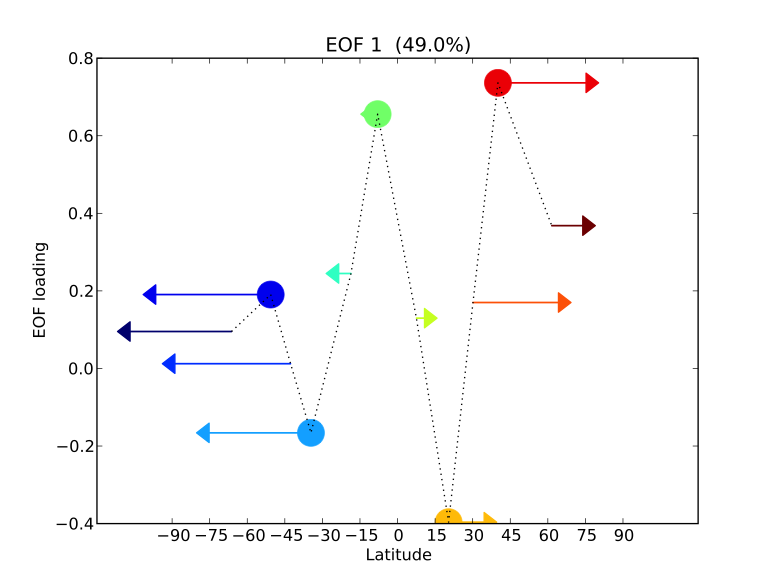
Using this pattern, we identified a robust, multiple-model fingerprint of anthropogenic climate change. The principal features of this fingerprint are that wet regions become wetter, dry regions become drier, and the storm tracks and subtropical dry zones shift poleward (Figure 2).
This fingerprint proved detectable in observational data and was attributable to anthropogenic factors (aerosol emissions, ozone depletion, and especially greenhouse gas emissions).2
Detection and Attribution of Anthropogenic Changes in Global Cloud Cover
Climate models universally predict future increases in global average surface temperature in response to a doubling of pre-industrial levels of atmospheric carbon dioxide, but the expected warming for carbon dioxide doubling (known as climate sensitivity) varies from model to model. Numerous analyses have indicated that much of the model spread in climate sensitivity is attributable to differences in how models simulate current and future cloud changes.
Clouds are difficult for climate models to simulate accurately. Their optical and radiative properties are affected by very small-scale physical processes, but their impacts on the climate system occur at regional and global scales. Moreover, known biases and spurious artifacts in existing satellite data sets hamper the interpretation of differences between observed cloud behavior and cloud output in model simulations.
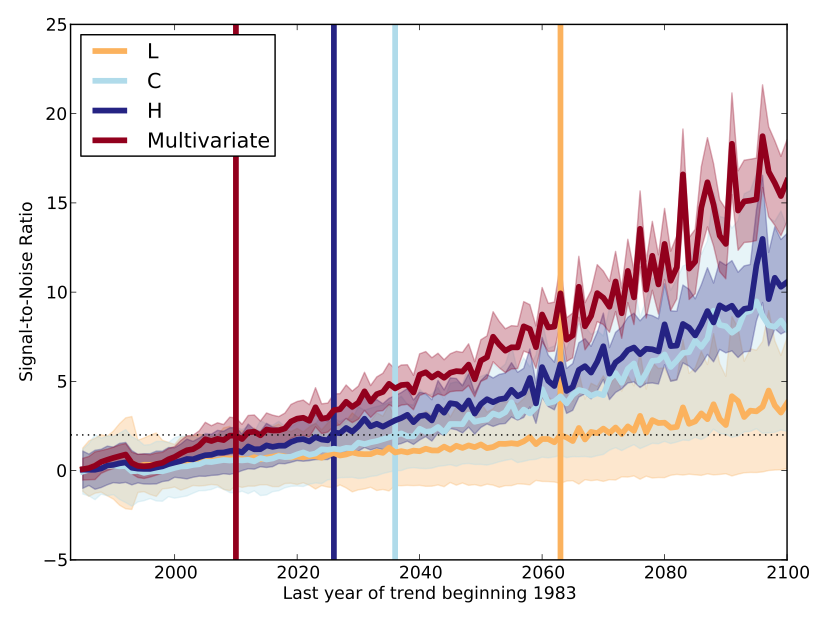
Nevertheless, we identified a robust fingerprint of externally forced changes in global cloud patterns, and showed that the model-expected signal is expected to emerge from background noise within the lifetime of current satellite missions (Figure 3).
While overall detection and attribution results were inconclusive because of the poor quality of the observations, we demonstrated that global cloud cover patterns are shifting poleward in two observational data sets, and that this shift is much larger than predicted by models.3
Detection and Attribution of Changes in the Amplitude and Phase of the Annual Cycle of Atmospheric Temperature
In many regions of the world, the seasonal cycle of temperature and moisture has profound impacts on biological and agricultural systems. Understanding anthropogenic perturbations to the seasonal cycle (both past and future) is of real practical benefit. Yet virtually all published climate-change detection and attribution research has focused on changes in annually and decadally averaged data. Studies do not consider externally forced impacts on the phase and amplitude of the seasonal cycle, despite a clear physical understanding that certain human influences (such as stratospheric ozone depletion and biomass burning) have seasonally and geographically specific impacts on climate.
In the third year of our project, we addressed this gap in detection and attribution research. Our focus was on tropospheric and stratospheric temperature. We considered three different issues: (1) how well do current climate models reproduce the observed climatological patterns of the phase and amplitude of the annual and semiannual cycles; (2) isolating the phase and amplitude fingerprints of different individual forcing mechanisms; and (3) whether anthropogenic changes in phase and amplitude are statistically identifiable in satellite measurements of atmospheric temperature. We have made progress on all three issues, as follows.
Model Evaluation
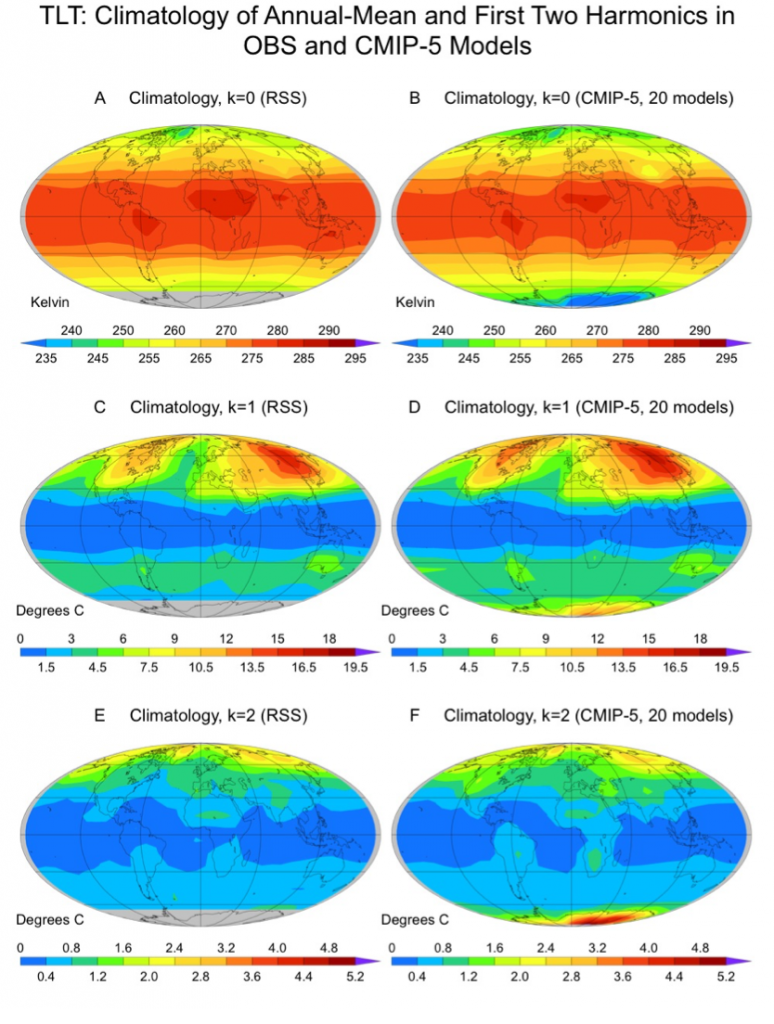
For both tropospheric and stratospheric temperature, most climate models from Phase 5 of the Coupled Model Intercomparison Project (CMIP-5) successfully capture the observed geographical patterns of the climatological-mean phase and amplitude of the annual and semiannual cycles (Figure 4). This enhances our confidence in the feasibility of using CMIP-5 models for the seasonal cycle detection and attribution study.
Single Forcing Runs
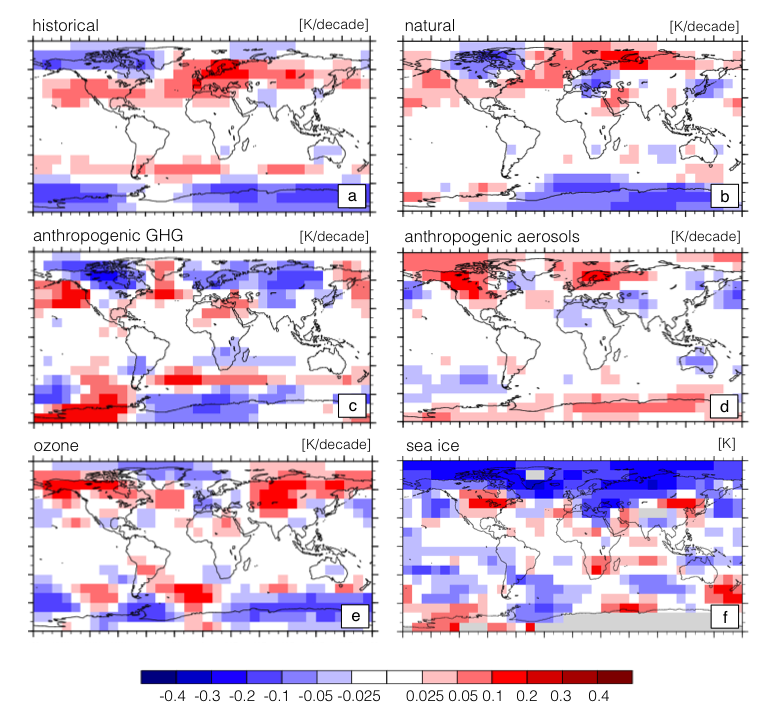
We have used CMIP-5 single-forcing simulations (and simulations with natural forcing only, anthropogenic forcing only, and combined natural and anthropogenic forcing) to better understand the effect of individual factors on the phase and amplitude of the annual cycle. We also studied the causes of phase and amplitude changes with innovative in-house simulations performed as part of a perturbed physics ensemble (Figure 5). We find that anthropogenic forcing and Arctic sea-ice loss have similar impacts on the annual cycle of lower tropospheric temperature. In both cases, the amplitude decrease in high northern latitudes is a consequence of winter warming.
Detection and Attribution Results
Our preliminary results suggest that it may be feasible to formally identify—in satellite-based atmospheric temperature measurements—the model-predicted fingerprints of anthropogenic changes in the amplitude of the annual cycle. However, it is less clear whether there are statistically identifiable anthropogenic fingerprints in the changing phase of the seasonal cycles of tropospheric and stratospheric temperature.
The difficulties in detecting phase changes in the annual cycle arise for a number of reasons (e.g., phase changes are inherently noisy, particularly at high latitudes, and tropical temperatures have a large semiannual cycle, which can hamper estimation of changes in seasonality). An additional problem is uncertainty in the observations themselves. From our long-term collaboration with scientists at Remote Sensing Systems in Santa Rosa, California, we are aware that a new (and soon to be released) version of their satellite atmospheric temperature data may have important changes in phase behavior. The changes arise from new, improved procedures for accounting for the effects of two factors: satellite orbital drift and the transition between older and more advanced space-borne microwave radiometers.
Scientifically, it seems advisable to wait for the next version of the Remote Sensing Systems atmospheric temperature data set (available in early 2016) before bringing our detection and attribution study to a conclusion. We anticipate that at least two publications will result from this work. The first publication (led by Ben Santer) will deal with the model evaluation aspects and the formal detection and attribution analysis. The second paper (led by Ivana Cvijanovic) will discuss the phase and amplitude changes inferred from the single-forcing simulations and the uncertainty quantification simulations with high and low sea-ice extent. We expect to complete both papers by mid-2016.
Impact on Mission
This project supports the Laboratory’s strategic focus area of energy and climate by advancing the state of the art in computational models for detecting climate change and attributing its cause.
Conclusion
The research performed under this project has continued LLNL’s long-standing tradition of pioneering detection and attribution research. In the first two years, we introduced new methods for the evaluation of climate model performance at different spatial scales, identified externally forced fingerprints in zonal-mean rainfall and cloud data sets, compared the signal-to-noise behavior of different cloud properties, and examined the efficacy of multivariable detection and attribution methods. In the final year, we examined model skill in representing observed spatial patterns of the phase and amplitude of annual and semiannual cycles of atmospheric temperature, analyzed simulations with individual and combined forcing factors (and perturbed physics ensembles) to improve understanding of the underlying causes of changes in seasonality, and performed a preliminary detection and attribution analysis of seasonal cycle changes. This body of work demonstrates and solidifies LLNL’s continued leadership role in climate change research.
References
- Marvel, K., D. Ivanova, and K. E. Taylor, “Scale space methods for climate model analysis,” J. Geophys. Res. Atmos. 118(11), 5082 (2013). LLNL-JRNL-613433.
- Marvel, K., and C. Bonfils, “Identifying external influences on global precipitation,” Proc. Natl. Acad. Sci. USA, 110(48), 19301 (2013). LLNL-JRNL-641122.
- Marvel, K., et al., “External influences on modeled and observed cloud trends,” J. Climate, 28, 4820 (2015).
Publications and Presentations
- Santer, B., "External influences on modeled and observed cloud trends." J. Climate 28, 4820 (2015). LLNL-JRNL-666336. http://dx.doi.org/10.1175/JCLI-D-14-00734.1
- Marvel, K., Detecting precipitation changes in CMIP5 models and observations at multiple spatial scales. 12th Intl. Mtg. Statistical Climatology, Jeju, Korea, June 24–28, 2013. LLNL-ABS-629252.
- Marvel, K., and C. Bonfils, Identifying external influences on global precipitation. American Geophysical Union Fall Mtg., San Francisco, CA, Dec. 9–13, 2013. LLNL- ABS-641462.
- Marvel, K., and C. Bonfils, “Identifying external influences on global precipitation.” Proc. Natl. Acad. Sci. USA, 110(48), 19301 (2013). LLNL-JRNL-641122.
- Marvel, K., and M. Zelinka, Fingerprints in the clouds. American Geophysical Union Fall Mtg., San Francisco, CA, Dec. 9–13, 2013. LLNL-ABS-641917.
- Marvel, K., D. Ivanova, and K. E. Taylor, “Scale space methods for climate model analysis.” J. Geophys. Res. Atmos. 118(11), 5082 (2013). LLNL-JRNL-613433.


