Susan Zimmerman (14-LW-091)
Abstract
The climate of the last 1,000 years is dominated by the inception, persistence, and abrupt end of the Little Ice Age, a period of unusually cold conditions between 1250 and 1850 when glaciers in Europe expanded and rivers such as the Thames froze solid during the winter. A key question in climate research today is whether the end of the Little Ice Age was a natural climate variation or the result of anthropogenic increase of carbon dioxide in the atmosphere from industrialization. We produced the first directly dated record of glacial advance in North America, which was the first comparison of temperature-dominated glacial advance with precipitation-dominated tree-ring and lake records. This was also the first time that the precipitation signal dominated by the El Niño and Southern Oscillation and the temperature signal dominated by the Intertropical Convergence Zone (commonly known as the doldrums) near the equator have ever been compared using glacier and lake records together. The expression of these climate changes over the last 1,000 years in climate models has become a key tool for understanding future changes, but no comparison of the El Niño and Southern Oscillation patterns that we examined existed previously in the published literature.
Background and Research Objectives
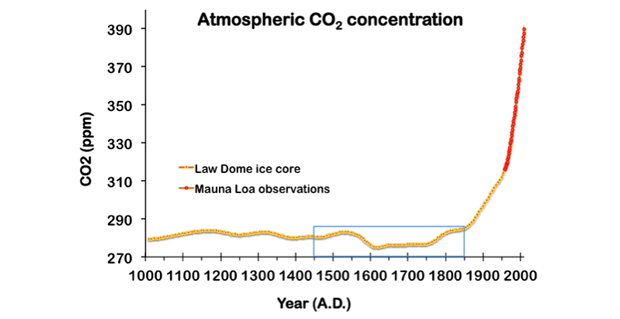
Abundant evidence about the Little Ice Age (1250–1850) suggests that the cold temperatures were global and that the period terminated by abrupt warming starting around 1850, just at the time that atmospheric carbon dioxide began to rise significantly (Figure 1). One of the most critical questions in climate science today concerns the abrupt end of the Little Ice Age: was it a natural fluctuation of the climate back to a warmer state, or was it a result of the modification of the climate system by anthropogenic changes inflicted during the Industrial Revolution?Reconstruction of natural glacier variability in New Zealand and Switzerland provides a persuasive argument that the end of the Little Ice Age was the result of anthropogenic climate change. During the Little Ice Age, Swiss glaciers were at their maximum extent in the last 10,000 years (the Holocene epoch),2 while New Zealand glaciers had retreated hundreds of meters up-valley from their Holocene maxima.3,4 This asynchrony between southern and northern hemisphere glaciers over the Holocene is driven by natural, long-term changes in insolation. Putnam et al.4 thus argue that the rapid, synchronous retreat of glaciers in both locations over the last 150 years is the result of anthropogenic forcing of climate.
We proposed to test this hypothesis by reconstructing glacier histories in the Sierra Nevada. The Sierra Nevada are at a northern latitude similar to Switzerland’s, but are influenced primarily by Pacific Ocean conditions, like New Zealand. If the Putnam hypothesis is correct, glaciers in the Sierra Nevada should have been near their Holocene maxima during the Little Ice Age, like the Swiss glaciers. In addition to testing this hypothesis, our work was motivated by the need to better understand how conditions in the Sierra Nevada are affected by different parts of the climate system. The snowpack in the Sierras is the major source of water to California’s cities and farms, and has already begun to decrease significantly because of human interference in the climate system.5,6 By reconstructing past glacial conditions, the Sierran snowpack can be understood in the larger context of Earth’s climate system.
We proposed two objectives: precisely map and date the last glacial maximum moraines in the Sierra Nevada, and integrate the glacial records with records of drought from Mono Lake in the eastern Sierra and other regional records, and with climate model reconstructions of California drought.
Scientific Approach and Accomplishments
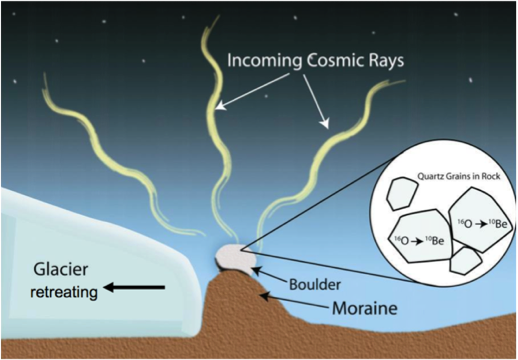
To reconstruct the past positions of the Sierran glaciers, we applied beryllium-10 surface-exposure dating to the rocky moraine deposits that mark past positions of the glaciers (Figure 2). Samples of several boulders from each ridge were collected, and then crushed and purified in the chemistry lab to isolate the beryllium-10 formed in the rock during the time since the retreat of the glacier. The beryllium-10 to beryllium-9 ratio of the purified sample was analyzed by accelerator mass spectrometry, and the time since exposure was calculated. Though many accelerators can measure beryllium-10 to beryllium-9 ratios of samples exposed for thousands of years, the short time since the end of the Little Ice Age means a very small amount of beryllium-10 has been accumulated in the rocks. Livermore's Center for Accelerator Mass Spectrometry system is the only laboratory in the world that can make high-precision beryllium-10 measurements on such young samples.
Figure 2. Surface-exposure dating. Boulders are transported down canyon and deposited by a glacier in a ridge called a moraine. When the glacier retreats, the boulder is exposed to cosmic rays, which interact with oxygen in the rock to form beryllium-10 (10Be). The amount of 10Be accumulated is measured by accelerator mass spectrometry, allowing the time since exposure to be calculated. Figure courtesy of J. Schaefer.
We have found that a major hurdle to the integration of lake records with high-precision glacial records and climate model experiments is the fact that paleoclimatic changes in lake records often cannot be dated with better than multi-centennial precision. This introduces uncertainty in the correlation of lake changes (usually wet or dry) with glacial advances, which in the mid-latitudes are generally controlled by temperature.7 In addition, lake changes can’t be correctly correlated to other regional and global paleontology records, preventing the comparison of spatial and temporal patterns in paleontology data with those in climate model experiments. We have made initial steps toward the rigorous dating of fossil pollen, long identified as a potentially valuable material for radiocarbon dating.8 We used flow cytometry, developed to sort biological cells, to cleanly separate the pollen from charcoal and other undesirable organic material in the lake mud.
Accomplishments
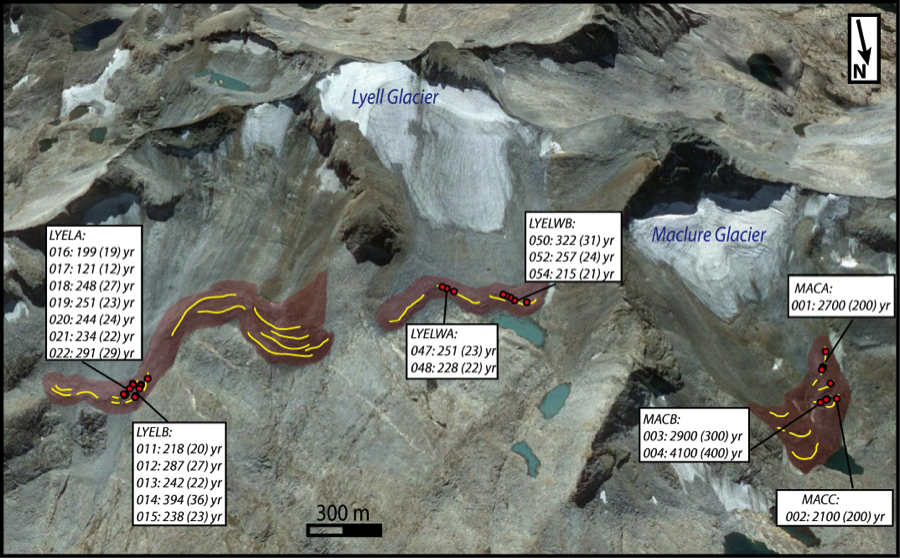
We measured the first Little Ice Age dates in the Sierra Nevada, at the Lyell glacier in Yosemite National Park (Figure 3). This glacier has been continuously monitored for nearly 100 years, and our dates extend the known history of the glacier significantly. The dates also suggest that the Lyell glacier stood at its Holocene maximum during the Little Ice Age, a prediction of the Putnam et al. hypothesis. In contrast to the step-wise retreat of the New Zealand glaciers, there is no other glacial deposit between the pre-Holocene Recess Peak deposit and the Little Ice Age moraine.
Similar deposits in front of other glaciers do not give Little Ice Age dates, indicating differences in glacier behavior or heterogeneity in the preservation of glacial deposits between canyons. Our work was designed to uncover this heterogeneity because we selected canyons along a latitudinal and elevational gradient and different types of glaciers. These dates bear further investigation, but will improve our understanding of the geologic processes involved in the construction of glacial moraines in the Sierras, and yield a record of glaciation before the Little Ice Age in the Sierra Nevada, which at the present time is mostly unknown.
We measured high-resolution, pollen-based radiocarbon ages for a late Holocene climate record from Mono Lake as a prelude to high-precision chronologies for lake records. We dated nine fossil pollen samples between two well-dated volcanic tephra samples (solid material from a volcanic eruption), and our results suggest that, with proper attention to sample preparation, fossil pollen can improve the precision of lake chronologies to 100 years or better.
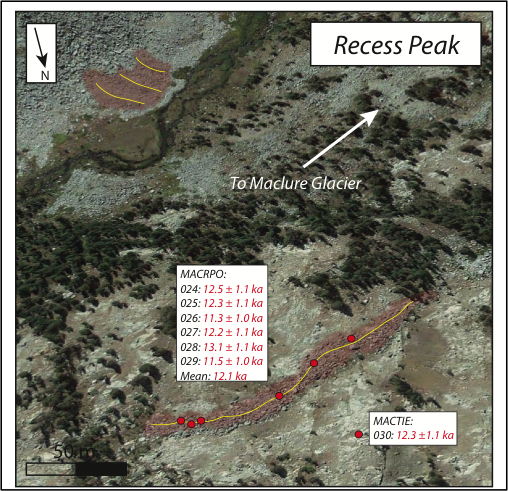
We determined that the Recess Peak glacial advance ended about 12,100 years ago, with good agreement between 6 boulders on a single moraine ridge (Figure 4). This age falls within the Younger Dryas cold period, a time after the continental ice sheets began to retreat, but when much of the Earth returned briefly to glacial conditions. Younger Dryas moraines are a major feature of glacial canyons in Europe and New Zealand, but until this study, Younger Dryas moraines had not been identified in the Sierra Nevada.
Figure 4. Google Earth image of the Recess Peak moraines downslope from the Maclure glacier in the eastern Sierra Nevada. Moraines deposited when the glaciers were more extensive are colored red, with their crests marked by the yellow lines. Red dots mark individual boulder samples, and dated samples are indicated by sample number and age, with uncertainty, in thousands of years (ka). Moraines at 37.771° latitude, -119.270° longitude, and about 3,225-m elevation.
Impact on Mission
Our work in integrating the glacial history of the Sierra Nevada into the regional records of climate, and using millennium runs of global climate models to examine the influence of the El Niño and Southern Oscillation, supports the Laboratory’s core capabilities in energy and climate research. Researching the mechanisms of climate change is relevant to LLNL’s strategic mission focus in understanding climate challenges and enabling climate projections at the regional scale.
Conclusion
In summary, we achieved our goals of mapping and dating glacial moraines in several canyons of the Sierra Nevada, including identifying Little Ice Age moraines of the Lyell glacier in Yosemite National Park. Heterogeneity of ages in other glacial canyons invites future work to improve our geological understanding of glaciation and climate change in the Sierra. The iteration between paleo-datasets and climate model results will both increase our understanding of the climate mechanisms causing the changes seen in the paleontology records, as well as provide support for the ability of the climate models to realistically model the climate system.
References
- Etheridge, D. M., et al. “Historical CO2 records from the Law Dome DE08, DE08-2, and DSS ice cores." Trends: A Compendium of Data on Global Change. Carbon Dioxide Information Analysis Center, Oak Ridge National Laboratory, Oak Ridge, TN (1998).
- Schimmelpfennig, I., et al., “Holocene glacier culminations in the Western Alps and their hemispheric relevance.” Geology 40, 891 (2012).
- Schaefer, J. M, et al., “High-frequency holocene glacier fluctuations in New Zealand differ from the Northern Signature.” Science 324, 622 (2009).
- Putnam, A. E., et al. “Regional climate control for glaciers in New Zealand and Europe during the pre-industrial Holocene.” Nat. Geosci. 5, 627 (2012).
- Bonfils, C., et al., "Detection and attribution of temperature changes in the mountainous Western United States.” J. Climate 21, 6404 (2008).
- Barnett, T. P., et al., “Human–induced changes in the hydrology of the Western United States.” Science 319, 1080 (2008).
- Oerlemans, J., “Extracting a climate signal from 169 glacier records.” Science 308, 675 (2005).
- Brown, T. A., et al. “Radiocarbon dating of pollen by accelerator mass spectrometry.” Quaternary Res. 32, 205 (1989).
Publications and Presentations
- Hidy, A. J., et al., 10Be exposure dating of Little Ice Age and Recess Peak moraines in the Sierra Nevada, California. (2015). LLNL-POST-668171.


