J. S. Kallman (15-ERD-028)
Abstract
Ptychography is a form of microscopic imaging that employs scanning coherent diffraction. Recently made practical by the development of new computational algorithms, ptychography is useful when it is difficult to make an effective lens for the coherent probe or when it is desired to image both an object’s phase and attenuation. Ptychography can be a powerful tool for nondestructive characterization using optical, x-ray, or particle-based imaging. Potential applications range from biological imaging and metrology for National Ignition Facility capsules, to integrated-circuit assurance. In ptychography, data is collected by acquiring diffraction patterns from overlapping regions on the subject. An iterative algorithm combines these diffraction patterns into a reconstructed image. We developed and implemented two acceleration methods: one based on using a computational transform to follow the changing size of the diffracted beam in the modeled data acquisition system (and which could be used for any reconstruction technique), and the other based on our experience with accelerating conjugate-gradient reconstruction of computed tomography data (primarily useful for conjugate-gradient reconstruction). We developed a state-of-the-art reconstruction code suite with these acceleration capabilities embedded in it. To test our algorithmic concepts on real data, we also developed an optical ptychography data-acquisition system.
Background and Research Objectives
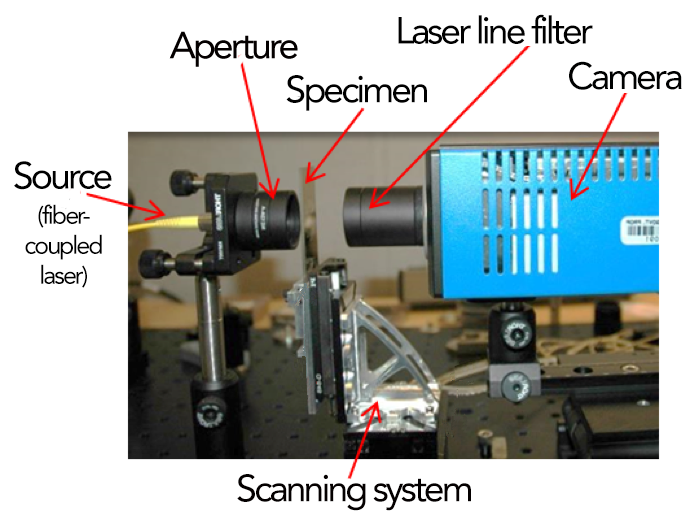
Ptychography is a microscopic technique that can be used for imaging particles and electromagnetic wavelengths for which it is difficult to fabricate lenses or mirrors (Rotenburg 2007; Guizar-Sicairos and Fienup 2008; Maiden and Rotenburg 2009; Dierolf et al. 2010). This technique enables the reconstruction of both the phase-delay and attenuation of a thin two-dimensional or layered three-dimensional object of interest (Maiden et al. 2012). Ptychography has been used to image biological and technological subjects using visual light, x-rays, and electrons (Maiden et al. 2012; Thibault et al.2008; Humphry et al. 2011). In its most basic form, ptychography requires a coherent probe (such as laser light or synchrotron x-rays), an aperture, a scanned target, and a way to measure the diffraction pattern that results from the interaction between the probe and the target (see Figure 1).
A variety of iterative algorithms for reconstructing ptychographic data have been developed, among them the extended Ptychographic Iterative Engine (ePIE) (Maiden and Rodenburg 2009), the difference map (Thibault et al. 2008), and the conjugate-gradient methods (Guizar-Sicairos and Fienup 2008).
We proposed two techniques to accelerate the reconstruction of ptychographic data: (1) using the Talinov transform in the system modeling (Fleck et al. 1976, Feigenbaum et al. 2013), and (2) using the approximate-error technique in conjugate-gradient reconstruction (Kallman and Azevedo 2012). Every ptychographic reconstruction algorithm incorporates a model of the optical system used to collect the data. In simple cases, that model may consist of just the probe, the object to be reconstructed, and simple diffractive propagation. The model can also include lenses, apertures, obscurations, and other components.
When we began our work, the state-of-the-art for modeling in ptychographic reconstruction was to have a model that was computed at a single spatial resolution. The resolution of the probe was the same as the resolution of the object, as well as the resolution of all the computations through the optical system (including the detector). If the detector has a much larger area than that of the object, a high-resolution reconstruction requires modeling the system at high resolution over that large detector area, even if the detector renders coarse pixels. Computationally, this is very wasteful. One of our proposed acceleration techniques was to use the Talinov transform (Fleck et al. 1976; Feigenbaum et al. 2013), which allows the simulation to dynamically adjust resolution to follow size changes in the propagating beam. This decoupling of the resolution between detector and reconstruction is especially useful in ptychography, where the resolution and size of reconstruction are very flexible.
Descent-optimization methods (such as conjugate-gradient descent) start with an arbitrary estimate of the variables of interest, then iteratively improving that estimate to minimize the discrepancy between the recorded and modeled data. In ptychography, the variables of interest are each pixel of the object and probe, as well as any other modifiable system parameters. Updating the estimate of variables requires first choosing a direction in this high-dimensional space, then searching along that direction (or "line") for a new solution that minimizes the error between data and model. There are many search directions that may be used, such as the gradient (in the steepest descent method) or one of the variety of conjugate-gradients (which can be more efficient) (Hager and Zhang 2006). The evaluation of the gradient takes up a large part of the computational effort of these methods, but the greatest effort is required by the line search. Our previous work in reconstruction of computed-tomography data had shown that, in many cases, the effort required for the line search could be reduced by at least one order of magnitude (Kallman and Azevedo 2012).
One of the goals of this project was to apply the same acceleration technique to conjugate-gradient reconstruction of ptychography data. The conjugate-gradient method is flexible, can add dimensions to compensate for a wide variety of unknowns (e.g., position uncertainties, probe uncertainties, and partial coherence), can be used to weight the data to reduce the effects of noisy inputs and eliminate saturated pixels, and settles to a definite answer (even if it may be a local minimum). This contrasts with other methods, such as the ePIE method, which can compensate for some uncertainties, but which never actually settle to a definite answer (and can fall into local minima as well).
Scientific Approach and Accomplishments
During the first year of this project, our effort was concentrated on implementation and evaluation of the acceleration techniques. This was done in simulation because we did not yet have equipment with which to perform live experiments. The second year was spent building up an optical ptychography testbed and showing that the accelerations observed during simulation could be replicated with experimental data. During the third year we spent time parallelizing the software we had written in the first two years and exploring potential applications where ptychography would be useful.
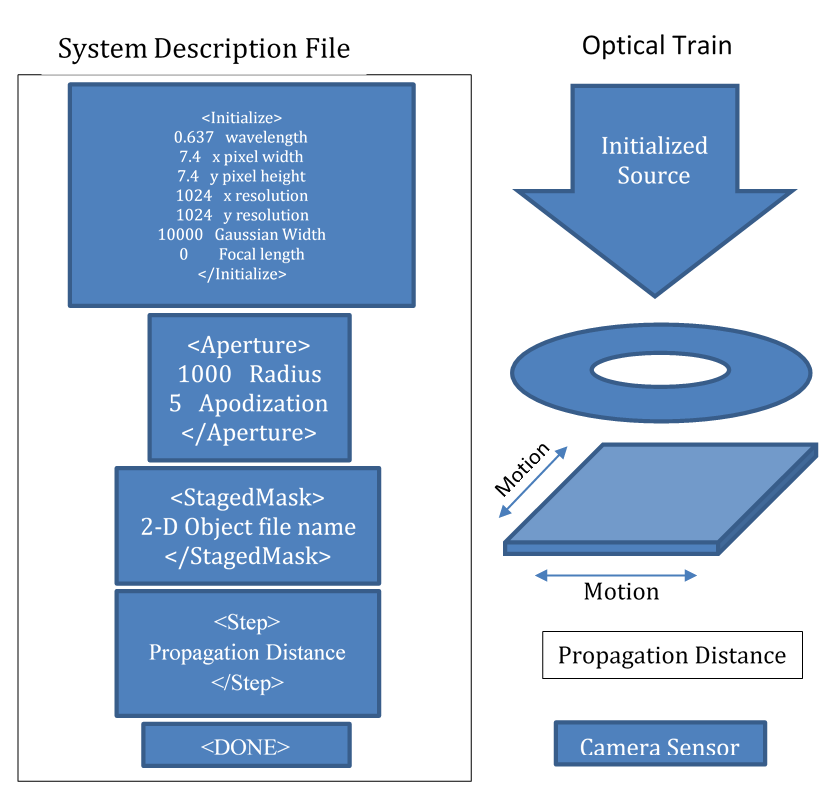
Reconstruction of ptychographic data requires a numerical model of the optical system from which the data are obtained. In Figure 2, the two-dimensional object in the staged mask and the probe wavefront that impinges on it are either given (for simulated data acquisition) or solved for (when data has already been acquired).
We wrote both forward simulations (where the object and probe are known) and software that reconstructs the object and probe. We implemented the ePIE method, the difference method, and the conjugate-gradient method for ptychographic reconstruction. All three techniques are iterative and involve simulating the passage of wavefronts both forward and backward through the optical-system model. These were the base methods into which we incorporated our two acceleration techniques.
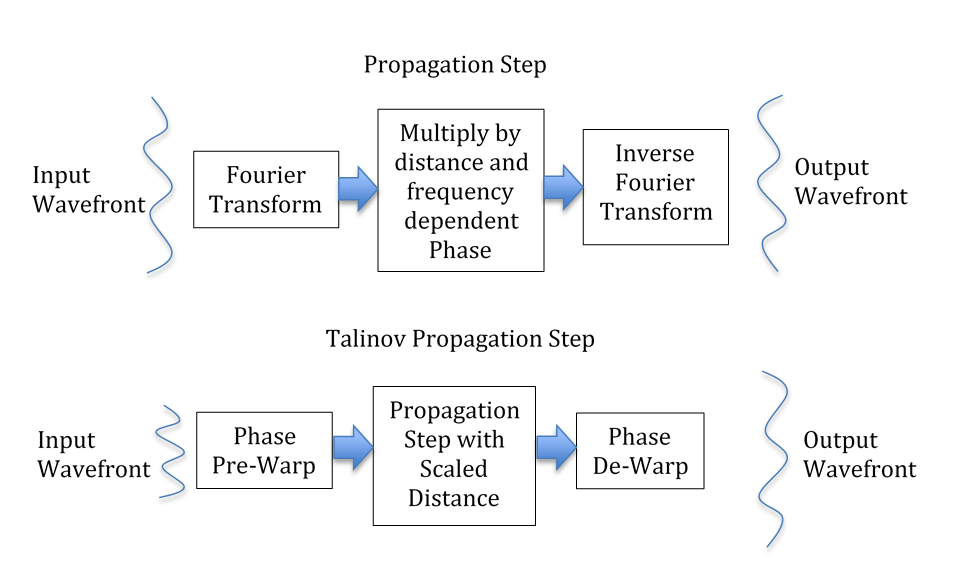
The first acceleration technique we investigated incorporated the Talinov-propagation step into the optical-system simulation. The normal propagation step breaks down into three parts: (1) Fourier transforming the initial wavefront, (2) multiplying the transformed wavefront by a phase factor that depends on the spatial frequency and the distance to be traversed, and (3) an inverse Fourier transform of the result. The Talinov-propagation step involves warping the phase of the initial wavefront, taking a normal propagation step with a modified distance, and applying a phase de-warping to the resultant wavefront (see Figure 3).
The Talinov-propagation step allows one to change the area covered by the wavefront without changing the number of samples used to represent it. This worked as expected, allowing us to reconstruct objects at a resolution finer than that of our camera without having to do all the forward and backward optical modeling at high resolution. The earlier in the optical train the Talinov step occurs, the greater the time savings. This acceleration technique is applicable to any ptychographic reconstruction technique. (See also Claus and Rodenburg 2015).
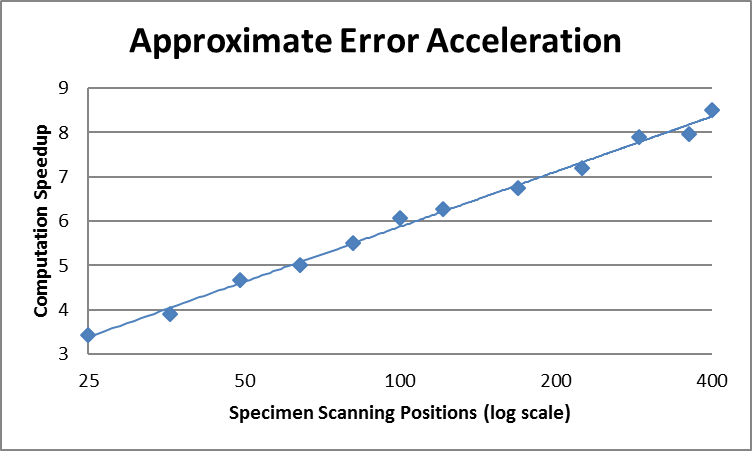
The second acceleration technique is applicable only to reconstruction techniques that use descent methods, such as the conjugate gradient. It makes use of the fact that, in the line search part of the algorithm, we only care where the minimum occurs. The value of the error at the minimum is irrelevant. If we have a good approximation of the error function that takes significantly less time to compute (where "good" means it has a minimum in about the same place), the result is a considerable speedup of the reconstruction. This is illustrated in Figure 4.
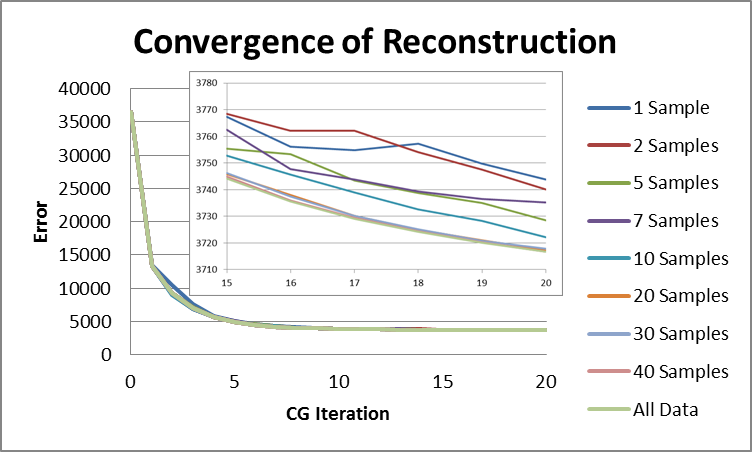
The approximation of the error was the sum of the squared differences between a random subset of the recorded and modeled data, as opposed to all the data. Experience with using the approximate-error conjugate-gradient method for computed-tomography reconstruction indicated that the random subset should consist of the square root of the number of data images. In examining how far we could push this, we discovered that reconstructing with a random subset consisting of a single data image would still converge to a solution. This is illustrated in Figure 5, which shows the absolute error as a function of reconstruction iteration for a data set consisting of 49 images, using subsets of various sizes.
After completing construction of an optical ptychographic-data-acquisition system in FY 2016, we reconstructed data acquired on it using the ePIE algorithm and computer graphics. We scanned an Air Force resolving-power test target (Figure 6, image A). The probe (B) was the output from a combination of a diffuser and an aperture. The reconstructed target image (C) shows that the target scanned has some deviations from the original design. Figure 6 shows the resultant reconstructions for the conjugate-gradient method using a single image to approximate the error as well as the result of using all the data. The speedup in this situation was a factor of twelve. The speedup was not a factor of forty-nine due to the other large computational effort in the conjugate-gradient reconstruction method (i.e., the computation of the gradient).
By collecting and reconstructing our own experimental data, we were able to learn about several practical design considerations of ptychography systems that we could not have learned from simulations alone. The optical-ptychography data-acquisition system was designed to be simple, compact, and easily reconfigurable to scan different targets and test different system geometries. There are three main components of the acquisition system: (1) probe generation, (2) target platform, and (3) propagation and detection. The first component creates an optical probe beam to illuminate the target. In simulation, any probe beam should work. However, it is convenient to use a probe size that is roughly the same size as the target to minimize the number of scan positions needed. Also, we learned through experimentation that it is desirable to create a speckled probe pattern with broad power-spectral density to avoid saturating the detector. Our setup included a selection of pinholes, diffusers, and lenses to allow us to flexibly choose a probe size and shape suitable for the applications. We also developed two target platforms to address two different applications. Our initial application was to image small targets with high resolution, so we used a vertically-oriented slide holder as a target stage to simplify the system geometry (shown in Figure 1). The probe transmitted through the target and the diffracted pattern was imaged on the other side. However, in year three we began pursuing a biological specimen-imaging application that requires moderate resolution of large, wet polymer targets that cannot be held vertically. We redesigned the target stage so that the polymer specimens could lie on a large, flat platform. In this configuration, the probe passed through the specimen, reflected off a mirror, passed through the specimen again, then propagated to the camera. While this reflection geometry is more complicated, it enables messy biological samples to be imaged easily. Finally, imaging resolution is primarily determined by the system geometry between the target and the camera. We experimented with several different geometries to optimize both performance and ease of use.
Impact on Mission
Ptychography is a potential tool for non-destructive characterization of integrated circuits, label-free imaging of biological specimens, and high-resolution surface characterization of National Ignition Facilitation (NIF) target capsules. This capability in new nondestructive characterization supports the Laboratory's core competencies of high-performance computing, computer-based simulation, and data science to evaluate the performance of existing optical systems for which physical testing is extremely limited.
Conclusion
There are two immediate potential paths forward for this work, one in label-free biological imaging and one in high-resolution surface characterization of NIF target capsules. We have begun collaborating with some of the biologists at the Laboratory and obtained preliminary data. Collaboration for NIF target-capsule characterization will require modifications to the ptychography testbed. In the longer term, we anticipate being able to assist the Laboratory’s Nondestructive Characterization Institute in x-ray characterization of integrated circuits.
References
Claus, D. and J. M. Rodenburg. 2015. “Pixel Size Adjustment in Coherent Diffractive Imaging Within the Rayleigh-Sommerfeld Regime.” Applied Optics 54 (8):1936—1944. doi: 10.1364/AO.54.001936.
Dierolf, M., et al. 2010. “Ptychographic Coherent Diffractive Imaging of Weakly Scattering Specimens.” New Journal of Physics 12 (3):035017. doi: 10.1088/1367-2630/12/3/035017.
Feigenbaum, E., et al. 2013. “Algorithm for Fourier Propagation Through the Near-Focal Region.” Applied Optics 62 (20):5030—5035. doi: 10.1364/AO.52.005030.
Fleck, J. A., Jr., et al. 1976. “Time-Dependent Propagation of High Energy Laser Beams Through the Atmosphere.” Applied Physics 10 (2):129-160. doi: 10.1007/BF00896333.
Guizar-Sicairos, M. and J. R. Fienup. 2008. “Phase Retrieval with Transverse Translation Diversity: A Nonlinear Optimization Approach.” Optics Express 16 (5): 7264—7278. doi: 10.1364/OE.16.007264.
Hager, W., and H. Zhang. 2006. “A Survey of Nonlinear Conjugate Gradient Method.” Pacific Journal of Optimization 2: 35—58.
Humphry, M. J., et al. 2012. “Ptychographic Electron Microscopy Using High-Angle Dark-Field Scattering for Sub-Nanometre Resolution Imaging.” Nature Communications 3 (730). doi: 10.1038/ncomms1733.
Kallman, J. S. and S. Azevedo. 2012. “Ray-Weighted Constrained-Conjugate-Gradient Tomographic Reconstruction for Security Applications.” The 2nd International Conference on Image Formation in X-ray Computed Tomography, Salt Lake City, UT, May 2012.
Maiden, A. M, and J. M. Rodenburg. 2009. “An Improved Ptychographical Phase Retrieval Algorithm for Diffractive Imaging.” Ultramicroscopy 109 (10): 1256—1262. doi: 10.1016/j.ultramic.2009.05.012.
Maiden, A. M., et al. 2012. “Ptychographic Transmission Microscopy in Three Dimensions Using a Multi-Slice Approach.” Journal of the Optical Society of America A 29 (8): 1606—1614. doi: 10.1364/JOSAA.29.001606.
Rodenburg, J. M., et al. 2007. “Transmission Microscopy Without Lenses for Objects of Unlimited Size.” Ultramicroscopy 107 (2-3): 227—231. doi: 10.1016/j.ultramic.2006.07.007.
Thibault, P., et al. 2008. “High-Resolution Scanning X-ray Diffraction Microscopy.” Science 321 (5887): 379—382. doi: 19.1126/science.1158573.
Publications and Presentations
Kallman, J. S. 2015. “Experience with Acceleration of Ptychographic Reconstruction.” The 19th Annual Signal & Image Sciences Workshop, Livermore, CA, May 13, 2015. LLNL-PRES-670518.
——— 2016. “Ptychography for Image Recovery.” Nondestructive Characterization Institute Seminar, Livermore, CA, June 15, 2016. LLNL-PRES-694917.
   

