Eric Matzel (14-ERD-051)
Abstract
Induced seismicity is inherently associated with underground fluid injections. If fluids are injected in proximity to a pre-existing fault or fracture system, the resulting elevated pressures can trigger dynamic earthquake slip, which could both damage surface structures and create new migration pathways.
The goal of this research is to develop a fundamentally better approach to geological site characterization and early hazard detection. We combine innovative techniques for analyzing microseismic data with a physics-based inversion model to forecast microseismic cloud evolution. The key challenge is that faults at risk of slipping are often too small to detect during the site characterization phase. Our objective is to devise fast-running methodologies that will allow field operators to respond quickly to changing subsurface conditions
Background and Research Objectives
A natural response to fluid injection is the creation of microseismicity. Often thousands of microquakes are associated with an injection well. These microquakes are not of concern, as they are far too small to be felt at the surface. However, they effectively illuminate the subsurface, allowing us to monitor plume growth and identify previously hidden faults. Precise seismic measurements on these microquakes is key.
Unlike natural seismicity, fluid-induced seismicity is strongly time- and space-dependent, driven by injection rate and pressure. To correctly address the induced seismic hazard, it is therefore necessary to introduce a strong hydromechanical underpinning. Current state-of-the-art methods for dealing with induced seismicity have several key deficiencies that motivate this research. In particular, current efforts almost exclusively use ad hoc or empirical approaches that are based on weak hydromechanical foundations. Also, these methods typically rely on a few simple measurements such as event location and magnitude, and ignore source mechanism information hidden in the data.
Our approach is centered around several geophysical techniques. Each of these exploits different information embedded in the seismic data, as well as our understanding of the hydromechanical behavior of reservoir systems. Several of these algorithms have been previously developed and applied to global-scale seismic monitoring, but have had limited microseismic application.
This project is organized around pre-existing data sets from field operations, in particular the Newberry and Salton Sea geothermal fields, which are well instrumented and have significant injection-related microseismicity. Field data provide an opportunity for extensive validation exercises, and allow us to test our techniques in noisy and data-limited environments. We also generate synthetic case studies using high-performance computing resources to gain a complete understanding of the underlying physics.
Scientific Approach and Accomplishments
The purpose of the geophysical analysis is to monitor the microseismicity associated with fluid injection. We want a sharp image of the subsurface in order to identify any faults or zones of weakness. We also want to identify changes in that image as injection proceeds. Since the shape of the microseismic cloud is driven by the evolution of the pressure front, tracking the pressure front involves locating the microquakes precisely and increasing the completeness of the catalog by detecting very small events. The techniques we focus on are summarized below:
- Ambient Noise Correlation is a form of seismic interferometry in which long periods of background noise recorded by the array are used to estimate the 3D velocity and attenuation structure of the earth. The velocity model is used in many downstream analyses, and therefore a high-quality 3D model is essential to achieving high accuracy and low uncertainty.
- Matched Field Processing is a seismic event detection algorithm used to identify discrete microseismic events in the continuous waveform data. Matched field processing is superior to many standard algorithms—such as short-term average / long-term average detection algorithms—at identifying small-magnitude events near the noise-floor of the data. It therefore provides a more complete picture of the seismicity occurring in the field.
- Bayesian Location (BayesLoc) is an event relocation and uncertainty estimation tool that uses Bayesian inference to rigorously account for potential sources of uncertainty in the data. The analysis provides the most likely location of microseismic events, and confidence volumes quantifying the intrinsic location uncertainty. As absolute location uncertainties can often be very large, potentially hundreds to thousands of meters, a good understanding of these confidence volumes is essential to making informed decisions about fault structures that may be observed.
- Virtual Seismometer Method is another form of seismic interferometry that employs cross-correlations between pairs of microseismic events. It is very sensitive to the earth structure between event pairs and their focal mechanisms. Using the virtual seismometer method analysis, we can cluster events that exhibit similar focal mechanisms. This clustering is essential to distinguishing larger, coherent fault structures from diffuse seismic sources such as fractured zones that create lower hazard.
- Empirical Forecasting. The empirical forecasting algorithms use a statistical model to connect injection rate with observed seismic event frequency and magnitude distribution. This model has relatively few free parameters, which are continuously recalibrated to observed data as injection proceeds. The calibrated model may then be used to forecast future event frequency within some forecast window. This tool provides a way to estimate the current level of seismic hazard, and how it may evolve based on different injection scenarios.
Each of these techniques has particular strengths and when used in combination, can greatly increase the resolution of the subsurface. The net result of these analyses is detailed information about field behavior for the operator: characterization data regarding earth structure, reactivated faults, and ongoing seismic hazard, warning if pressure and stress perturbations occur in unexpected locations, and an understanding of the intrinsic sensitivity of the monitoring array and any uncertainties associated with the results. If the results raise a red flag, this information can be combined with other monitoring data and analyses to make well informed but rapid decisions about how best to deal with seismic hazards.
A key objective of this research is to develop algorithms that can be run quickly, in near real-time, to allow operators to respond quickly to changing field conditions. With the exception of ambient noise correlation, all of the techniques described above can be run on a standard computer within a few hours of accessing data. The advantage of ambient noise correlation is that the calculations can be done inexpensively, before operations even begin.
Ambient noise correlation resolves the large-scale structure from the surface through the seismically active zone
A major advantage of the ambient noise correlation technique is that it strips away the dependence on earthquakes or artificial sources for seismic imaging. Problems of source location and velocity heterogeneities outside the region of interest are no longer present—only the structure between the seismometers contributes to the signal. In particular, it allows high-resolution imagery beneath dense seismic networks even in areas of low seismicity.1
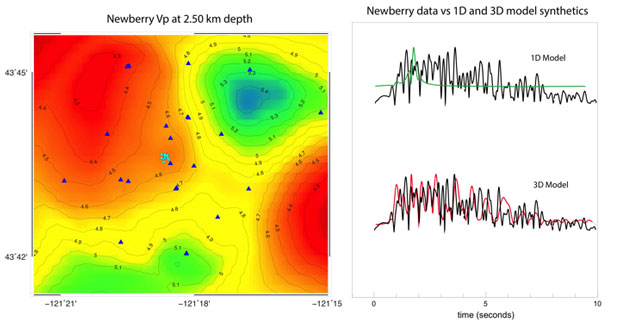
Using ambient noise correlation, we can obtain detailed images of the 3D structure surrounding an injection site. These images are precise enough that we can identify the source of the scattered energy seen in the data. An example of this is shown in Figure 1. Typically, this scattering would be treated as noise and discarded, because it is not captured by simpler models. With precise 3D models we can use subtle details in the recorded seismograms to locate the seismicity more precisely and to identify the style of faulting. We can also predict where future microseismicity will occur, as it generally falls near the most rapid changes in the velocity gradient.
Extending the completeness of the catalog using matched field processing
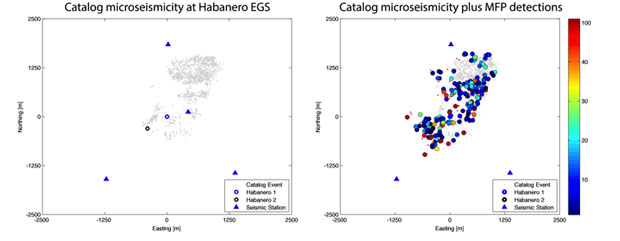
Matched field processing is an adaptation of a signal processing technique originally developed to locate continuous underwater acoustic sources.2,3 We calculate the wavefield structure across an array by estimating it directly from previously observed earthquakes, which contain contributions from direct and scattered seismic energy. Matched field processing detects small microseismic events that are often buried in the noise, extending the completeness of the catalog (Figure 2). These small events are valuable because they fill in details of the evolving pressure field. Regions that appear quiet may actually be quite active and small events are often precursors to larger ones.
Bayesian location
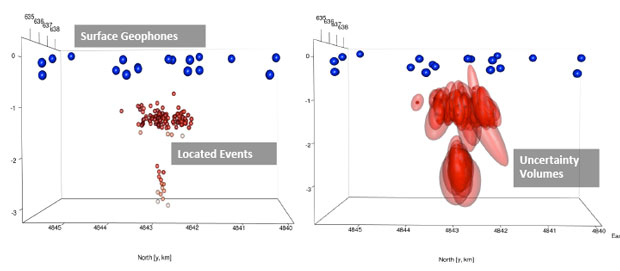
We simultaneously locate multiple micro-earthquakes following the Bayesian methodology of Myers et al.4 Bayesloc allows for probabilistic constraints on the arrival-time data, the travel time model, and the location parameters. BayesLoc also provides an estimate of location uncertainty, an essential feature to help distinguish real from phantom faults.
At Newberry, we chose a subset of 199 events with 1,441 P-wave picks and 1,267 S-wave picks. Figure 3 shows the locations along with their estimated accuracy. Note that the uncertainties in the locations are very large. Vertical errors are significantly larger than the horizontal errors, primarily due to the recording station geometry.
The cause of the relatively large uncertainty of the deeper events is due to small errors in the S-wave picks. Rotating the P- and S-wave energy to better isolate the S-wave particle motion improved picking accuracy and significantly decreased the size of the ellipsoids. Together with the improved earth model from ambient noise correlation, BayesLoc can be used to improve the precision of event locations.
Virtual seismometers and the zone of microseismicity
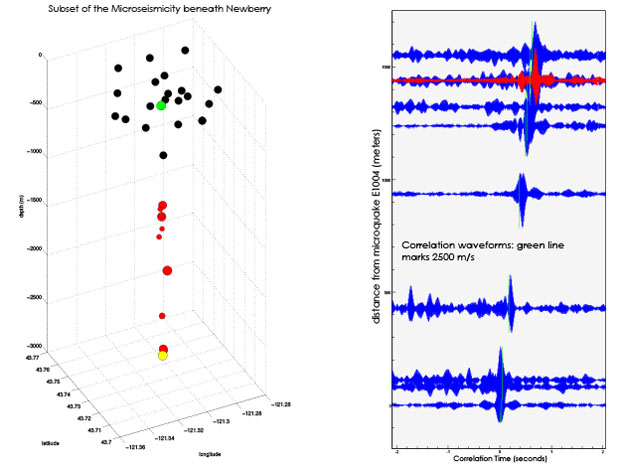
The virtual seismometer method provides fast, precise, high-frequency estimates of the Green's function between earthquakes.5,6 The method illuminates the subsurface precisely where the pressures are changing. It has the potential to image the evolution of seismicity over time, including changes in the style of faulting as injection proceeds.7 Given sufficient microseismicity, we can calculate detailed evolution of the wavefield. Where ambient noise correlation obtains the large-scale 3D structure of the entire site, the virtual seismometer method obtains the fine details in the tectonically active zone. An example of the technique at the Newberry geothermal field is shown in Figure 4.
Short-term seismic forecasting
Empirically based methods for hazard forecasting use an observed seismicity catalog, compiled from microseismic monitoring of the injection, to estimate the ongoing seismic hazard.8, 9, 10, 11 As the project proceeds, the growing catalog of events is used to continuously re-calibrate a model of earthquake frequency–magnitude distribution. These empirical approaches typically use simplified models of the underlying physical processes, leading to a manageable number of free parameters to be fitted to observed data. The calibrated model may then be used to forecast the future seismic hazard within some forecast window.8, 9 The quality of this forecast will depend on the fidelity of the chosen empirical model to the true system behavior, and the availability of sufficient seismic observations to properly constrain future seismic behavior.
Our empirical forecasting algorithm uses a simple statistical model with three free-parameters to connect injection rate with observed seismic event frequency. In particular, the model uses observed injection rates and pressures to calibrate a linear superposition model for pressure evolution in the reservoir. This pressure evolution is then correlated with observed seismic event frequency based on observed data. The model is then continuously re-calibrated to observed data as injection proceeds. The current model provides a rough but reasonable forecast of how seismic event count will change when, for example, the injection well is shut in (not producing but capable of producing). This provides an opportunity to understand how seismic hazard may evolve under various injection-management scenarios.
Impact on Mission
Induced seismicity is an inherent issue associated with energy technologies of particular interest to the Laboratory: geologic carbon sequestration, enhanced geothermal systems, and shale gas development. A strategy for assessing and mitigating seismic risk needs to be developed if large-scale fluid injection operations are to continue responsibly. Here, we have developed a system of techniques that are fast enough that they can be applied in real-time and synchronized with data acquisition. This work supports a central Laboratory mission in energy to advance the nation's security through the production, development, and deployment of energy resources and technology.
Conclusion
Geologic carbon sequestration, enhanced geothermal systems, and disposal of waste hydraulic fracturing fluid from shale gas development all involve injecting large volumes of fluid into the subsurface. If these fluids are injected near a pre-existing fault or fracture system, they could potentially trigger earthquakes of magnitudes that are sufficiently large to cause serious public concern. Microseismicity is closely associated with these technologies and can be used to monitor the evolution of the pressure field. The technologies developed here allow us to get refined measurements of the developing pressure field and make forecasts as operations proceed. The algorithms are fast and efficient and lend themselves to development for field environments.
References
- Campillo, M. and A. Paul, “Long-range correlations in the diffuse seismic coda.” Science, 229 547 (2003).
- Baggeroer, A. B., W.A. Kuperman, P. N. Mikhalevsky, “Matched field processing in ocean acoustics.” NATO Advanced Study Institute on Signal Processing for Ocean Exploration, Kluwer, Dordrecht, Netherlands (1993).
- Bucker, H. P., “Use of calculated sound field and matched-field detection to locate sound sources in shallow water.” Acoust. Soc. Am. 59(2), 368 (1976).
- Myers S. C., G. Johannesson, and W. Hanley, “A Bayesian hierarchical method for multiple-event seismic location.” Geophys J. Int. 171, 1049 (2007).
- Curtis, A., et al., “Virtual seismometers in the subsurface of the Earth from seismic interferometry.” Nature Geo. 2, 700 (2009).
- Hong, T-K., and W. Menke, “Tomographic investigation of the wear along the San Jacinto fault, southern California.” PEPI 155, 236 (2009).
- Matzel, E. M., et al., “Virtual Seismometers in Geothermal Systems: Looking Inside the Microseismic Cloud.” Proceedings, 41st Workshop on Geothermal Reservoir Engineering, SGP-TR-204, Stanford Geothermal Program, Stanford, CA (2016).
- Bachmann, C., et al., “Statistical analysis of the induced Basel 2006 earthquake sequence: Introducing a probability-based monitoring approach for enhanced geothermal systems.” J. Int. 186(2), 793 (2011).
- Mena, B., S. Wiemer, and C. Bachmann, “Building robust models to forecast the induced seismicity related to geothermal reservoir enhancement.” BSSA 103(1), 383 (2013).
- Shapiro, S., C. Dinske, and J. Kummerow, “Probability of a given-magnitude earthquake induced by a fluid injection.” Res. Lett. 34(22) (2007).
- Shapiro S., C. Dinske, and C. Langenbruch, “Seismogenic index and magnitude probability of earthquakes induced during reservoir fluid stimulations.” Leading Edge 29(3), 304 (2010).
Publications and Presentations
- Matzel, E. M., et al., Induced seismicity. (2016). LLNL-ABS-700396.
- Matzel, E. M., et al., Looking inside the microseismic cloud using seismic interferometry. AGU Fall Mtg., San Francisco, CA, Dec. 14–18, 2015. LLNL-PRES-680034.
- Matzel, E. M., et al., Microseismic processing for induced seismicity management at carbon storage sites. (2016). LLNL-PRES-700480.
- Matzel, E. M., et al., “Microseismic techniques for avoiding induced seismicity during fluid injection.” Energ. Procedia. 63, 4297 (2014). LLNL-ABS-648453. http://dx.doi.org/10.1016/j.egypro.2014.11.465
- Matzel, E. M., Real-time microseismic processing for induced seismicity hazard detection. (2016). LLNL-TR-707563.
- Matzel, E. M., et al., Virtual seismometers in geothermal systems: Looking inside the microseismic cloud. Stanford Geothermal Workshop 2016. LLNL-CONF-683265.
- Matzel, E. M., et al., “Virtual seismometers in geothermal systems: Using microquakes to illuminate the subsurface.” 40th Workshop on Geothermal Reservoir Engineering 2015, SGP-TR-204, Stanford Geothermal Program, Menlo Park, CA, Jan. 26–28, 2015. LLNL-CONF-666405.
- Morency, C., and E. Matzel, Virtual seismometers for induced seismicity monitoring. AGU Fall Mtg., San Francisco, CA, Dec. 14–18, 2015. LLNL-POST-670444.
- Rhode, A. A., E. M. Matzel, and D. C. Templeton, Applications of the virtual seismometer method to microseismic events at the Salton Sea geothermal field. (2016). LLNL-POST-698643.


