Todd Weisgraber (14-ERD-087)
Abstract
Additive manufacturing is a revolutionary technology that offers the ability to fabricate complex three-dimensional structures through photochemical, electronic, or thermal manipulation of a feeder stock of material such as a resin or metallic powder. The efficacy of each process is governed by several manufacturing parameters, which traditionally have been adjusted in the laboratory to achieve robust and repeatable structures. This experimental approach towards optimization is time intensive, so there is a need for a more rigorous approach to determine the fabrication parameters that will produce repeatable parts with the desired material properties and functionality. We have developed robust projection micro-stereolithography and electrophoretic deposition process models and optimization frameworks to provide a computational capability to streamline and improve these fabrication methods. We demonstrated these capabilities by optimizing a stereolithography resin for a large-area system and by controlling the morphology in electrophoretic deposition.
Background and Research Objectives
Additive manufacturing is a revolutionary technology that offers the ability to fabricate complex three-dimensional structures in a digital model through photochemical, electronic, or thermal manipulation of a feeder stock of material such as resin or metallic powder. By tightly coupling design and manufacturing, it is spurring innovation across diverse industries including aerospace and biomedicine. Lawrence Livermore is a national leader in the development of additive processes for producing novel materials for high explosives, advanced lasers, and stockpile stewardship applications.1 In an effort to improve and expand the limits of these technologies, this work emphasizes additional development and optimization of the computational process models for two additive manufacturing capabilities developed at LLNL: micro-stereolithography2 and electrophoretic deposition.3
In stereolithography, surface regions of a resin bath are selectively photo-polymerized by modulating a light source with a micro-mirror array. Three-dimensional structures can be built by lowering the substrate into the bath, exposing a new image onto the surface, and repeating this process, as shown in Figure 1(a).4 Though this method is polymer-based, other materials like metals and ceramics can be introduced by suspending nanometer-scale particles in the resin and then thermally post-processing the part to remove the polymer and fuse the particles into a solid structure. Electrophoretic deposition is a process in which suspended nanoparticles are layered onto an electrode via electrokinetic forces. The deposited structures can contain multiple materials by introducing different particle types, and three-dimensional structures can be achieved by using dynamically configurable electrodes and creating sacrificial regions amenable to chemical etching or thermal treatment, shown in Figure 1(b).5 The efficacy of each process is governed by several parameters, which traditionally have been adjusted in the laboratory to achieve robust and repeatable structures. The appropriate fabrication parameters are highly dependent on the specific feedstock materials and parts, and can even vary during the manufacturing process. This empirical approach to find the optimal fabrication regime is extremely time and labor intensive. Moreover, as we advance fabrication technologies by incorporating multiple materials, more complex geometries, and scale up to larger build areas while maintaining fine-scale features, there is a need for a more rigorous approach to first determine if a given structure can be built and if so, select the best fabrication parameters that will produce repeatable parts with the desired material properties and functionality. Therefore, we have enhanced our electrophoretic deposition and stereolithography process models while developing an optimization framework for each so we can apply these computational capabilities to improve our understanding of the manufacturing physics and streamline the fabrication process for new materials and structures.
Scientific Approach and Accomplishments
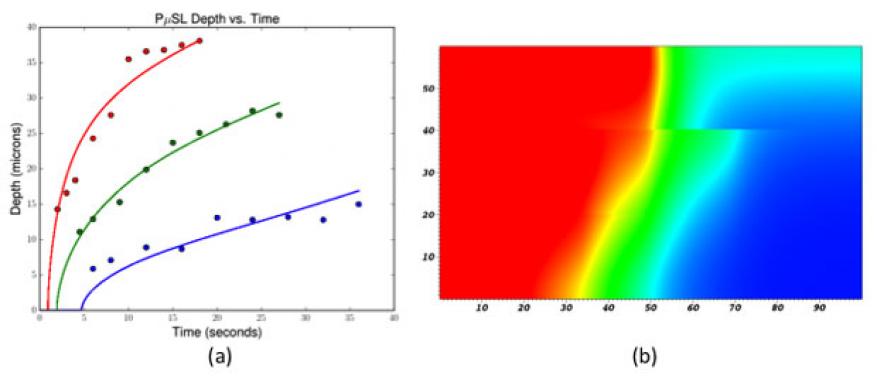
To enable the projection micro-stereolithography model to be amenable to high-performance computing, we implemented a set of partial differential equations describing the light interaction with and polymerization of the monomer resin within the Chombo adaptive mesh-refinement mathematical framework, which is scalable to over 105 processors.6 The model requires, to accurately simulate polymerization, characterization of the constituents of the resin, including the monomer (HDDA), the photo-initiator (Irgacure 819), and the photo-absorber (Sudan-1). First, the absorptivity of the photo-initiator and chemical absorber were measured using a photo-spectrometer. The detailed reaction kinetics for the monomer and photo-initiator combination were also needed. Working with analytical chemists, we measured the temporal evolution of the polymer conversion via Fourier transform infrared spectroscopy, and extracted the rates of propagation and termination as a function of conversion and incorporated them in the kinetic description of Lovestead, O’Brien, and Bowman.7 In addition, the presence of oxygen in the build environment can reduce the rate of polymerization by quenching the free radicals generated by the photo-initiator, and we also extracted the rate of this process from the Fourier transform infrared spectroscopy characterization. We validated the model by performing a series of depth experiments in which we fabricated several bridge structures with variable light intensities, exposure times, and environmental oxygen concentrations, and measured the depth of the feature spanning the two support columns of the bridge. We then ran the model with the same processing parameters and found that the predicted feature depths were in excellent agreement with the experiments for a wide range of these manufacturing parameters. By incorporating the detailed chemical properties of the resin, our polymerization simulation capability is one of the most qualitatively predictive additive-manufacturing process models available. Figure 2 shows a comparison between the model predictions and experimental measurements of depth for a subset of the parameters from the validation, and a snapshot from a simulation of multi-layer feature fabrication, another recent accomplishment and capability unique to LLNL.
The second major accomplishment for stereolithography was the development of Chopt, our Python-based high-performance computing optimization framework. Because the computation time of polymerization simulations are only a few minutes, we chose the black box approach to optimization in which sensitivities of the objective function to the fabrication parameters are computed via finite differences using multiple evaluations of the forward model. This approach requires running several instances of the forward model in parallel. The number of simulations depends on both the cost function and number of independent optimization parameters. Chopt interfaces between the Chombo simulations, LLNL’s job control for their supercomputers, and the Python optimization libraries to autonomously iterate the optimization problem to convergence. Conforming to the JSON syntax, its input file specifies the bounds of the optimization parameters and the cost function, which is typically the output of a Python function that post-processes the simulation results. Chopt is completely general and scalable with an ability to simultaneously solve multiple optimization problems.
We routinely interact with the users and developers of the micro-stereolithography systems to identify fabrication issues that could be addressed with our new process-optimization capability. The development of the large-area micro-stereolithography platform, which uses a movable optical array that scans across the surface of the resin to achieve an order-of-magnitude increase in lateral part dimensions while maintaining small-scale feature size, required modification of the resin to accommodate a thicker polymerization layer. Without properly adjusting the resin to be compatible with the light-exposure parameters, a part like the one shown in Figure 3(a) could result. This build exhibits severe distortion because of inadequate polymerization and poor adhesion between layers. Determining the ideal resin mixture experimentally is extremely time intensive and requires developing an appropriate characterization methodology. With Chopt, we optimized the concentration of the photo-initiator and absorber in the resin to achieve an average degree of polymerization of 60% after a 10-s exposure. The objective function was the vertically integrated value of the monomer conversion within the layer. With our computationally optimized resin mixture, the large-area system was able to fabricate the robust hierarchical octet truss lattice in Figure 3(b) without the need for a costly empirical exploration of the processing parameters.
Unlike the continuum model for micro-stereolithography, the process model for electrophoretic deposition required a particle-based simulation to understand the relationship between the fabrication parameters and the morphology of the deposit. The model we developed computes particles trajectories at discrete time steps by calculating the forces on every colloid from the gradient of the total interaction potential and numerically integrating Newton’s equations of motion. We use LAMMPS8 (Large-Scale Atomic/Molecular Massively Parallel Simulator) to evaluate the internal (solvent–colloid and colloid–colloid) and external (electric field and wall) interactions that govern colloidal transport and deposit morphology within our simulations. Our solvent–colloid model is based on the Fast Lubrication Dynamics9 algorithm that adds pairwise dissipative lubrication and Brownian forces between nearby colloids to account for the solvent implicitly, rather than treating the solvent explicitly by simulating additional solvent particles. The colloid–colloid interaction is governed by the Derjaguin–Landau–Verwey–Overbeek potential that combines electrostatic and steric repulsion and van der Waals attraction between colloids with negligible surface conductance. Ions in the fluid rearrange to form electric double layers that screen the surface charge of colloids over the characteristic Debye length scale. We account for the screened electrostatic repulsion between electric double layers using a variant of the Yukawa potential, with a force constant that depends on measurable suspension properties, including the surface potential of colloids, relative permittivity, ion valence, temperature, particle radius, and Debye length. We model electrophoretic motion and deposition by simulating the external energy from an applied electric field that acts on colloids with effective charge in the direction perpendicular to the electrode. Details of these interaction potentials are described in our first publication.10
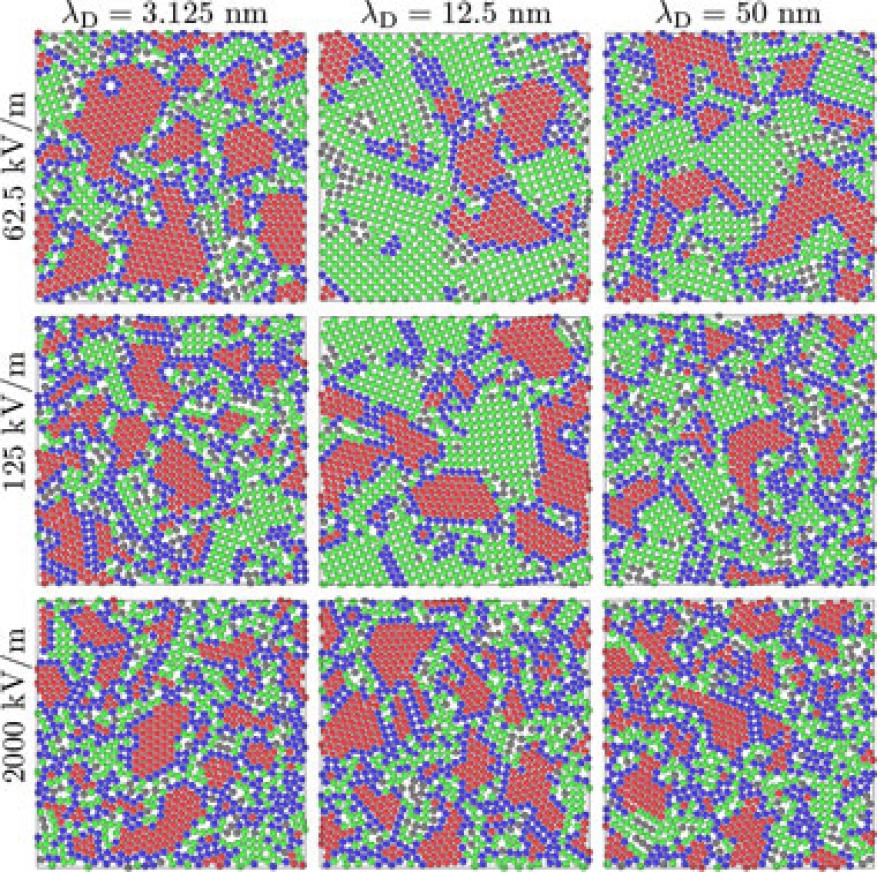
Figure 4 shows the top view of the first layer of nine different depositions (three values of Debye length and three values of the applied electric field), allowing us to explore how double-layer repulsion and field strength influence colloidal ordering at the electrode. Based on the two-dimensional coordination number, colloids are categorized (indicated by color) into one of two ordered domains (close or square packing), in a grain boundary, or none of the above. Domain sizes decrease with electric field for any Debye length while the proportion of hexagonally ordered domains and grain boundaries increase. At the highest field, the two-dimensional ordering maps for all Debye lengths appear the same. The starkest contrast occurs at lower fields where the largest domains are comprised mostly of square lattices for Debye lengths of 12.5 and 50 nm, and hexagonal domains for a Debye length of 3.125 nm. Understanding ordering at the electrode is important because the morphology of this first layer influences the degree of ordering throughout the deposit.
Because the electrophoretic deposition simulations are computationally expensive with typical computer run times on the order of a week, directly computing sensitivities for gradient-based process optimization is not feasible. Instead, we employed response surface optimization, which involves parametric simulations spanning a specified range of the process parameters.11 For each simulation, the cost function is computed and the results are fit to an N-dimensional analytical surface where N is the number of parameters. Because the surface is described analytically, the minimum is then easily determined.
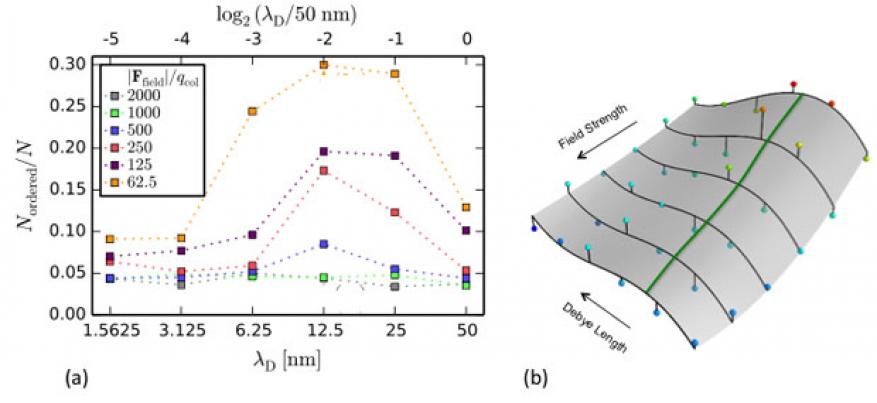
Figure 5(a) displays the fraction of ordered particles throughout the deposit for 36 simulations as a function of Debye length and electric field force. The degree of ordering was determined by a summation of two- and three-dimensional common-neighbor analyses. At a given Debye length, the fraction of ordered particles decreases with increasing electric field. However, for field strengths greater than 1000 kV/m, 95% of colloids within simulated deposits are unstructured and there is no clear trend in Nordered/N along the Debye length. At these large driving forces, inter-colloidal repulsion does not appear to influence the microstructure. Along electric field contours below 500 kV/m, Nordered = N exhibits a maximum at intermediate values of Debye length. Figure 5(b) shows the response surface derived from this data and the contour of maximum ordering predicted by the simulations. These results suggest that the suspension and deposition parameters can to tuned to provide enhanced control of the deposit morphology. If maximum ordering is desired, the simulations can provide insight into which suspension will pack with the minimum deposition time.
Impact on Mission
Our effort is directly aligned with the Laboratory's strategic core competencies in advanced materials and manufacturing and high-performance computing, simulation, and data science to address the scientific and engineering challenges of accelerating the design, fundamental understanding, and development of new materials and manufacturing processes with the aid of a new computational capability. Process improvements derived from our model optimizations have impacted Livermore research programs currently engaged in additive manufacturing development, including the National Ignition Facility and stockpile stewardship science. During the second year of our project, we recruited a postdoctoral researcher who developed the colloid deposition model, a capability unique to LLNL. It is currently being transitioning for use in an externally funded project by enhancing the model to explore resuspension effects.
Conclusion
We have successfully developed forward models and optimization frameworks for projection micro-stereolithography and electrophoretic deposition, two of LLNL’s novel additive manufacturing processes. By incorporating these models within optimization frameworks, we have demonstrated a systematic and robust approach to determine the ideal set of processing parameters to manufacture a variety of materials and structures. We are continuing the stereolithography optimization work with the ongoing development of new resins to support programmatic additive manufacturing deliverables for Lawrence Livermore. The flexibility of the electrophoretic deposition model allows for its expansion to simulate nonspherical, poly-disperse, and functionalized colloidal systems. It has been successfully integrated into an ongoing strategic partnership program with an external sponsor emphasizing new flexible display technologies.
References
- Sullivan, K. T., J. D. Kuntz, and A. E. Gash, “Electrophoretic deposition and mechanistic studies of nano-Al/CuO thermites.” J. Appl. Phys. 112(2) (2012). http://dx.doi.org/10.1063/1.4737464
- Zheng, X., et al., “Design and optimization of a light-emitting diode projection micro-stereolithography three-dimensional manufacturing system.” Rev. Sci. Instrum. 83(11) (2012). http://dx.doi.org/10.1063/1.4769050
- Pascall, A. J., K. T. Sullivan, and J. D. Kuntz, “Morphology of electrophoretically deposited films on electrode strips.” J. Phys. Chem. B 117(6), 1702 (2013). http://dx.doi.org/10.1021/jp306447n
- Fang, N., S. Sun, and X. Zhang, “Diffusion-limited photopolymerization in scanning microstereolithography.” Appl. Phys. A 79(8), 1839 (2004). http://dx.doi.org/10.1007/s00339-004-2938-x
- Besra, L., and M. Liu, “A review on fundamentals and applications of electrophoretic deposition (EPD).” Prog. Mater. Sci. 52(1),1 (2007). http://dx.doi.org/10.1016/j.pmatsci.2006.07.001
- Colella, P., et al., Chombo software package for AMR applications—Design document. Lawrence Berkeley National Laboratory, Berkeley, CA (2009).
- Lovestead, T. M., A. K. O’Brien, and C. N. Bowman, “Models of multivinyl free radical photopolymerization kinetics.” J. Photochem. Photobiol. A 159(2),135 (2003). http://dx.doi.org/10.1016/S1010-6030(03)00178-3
- Plimpton, S., “Fast parallel algorithms for short-range molecular dynamics.” J. Comput. Phys. 117(1), 1 (1995). http://dx.doi.org/10.1006/jcph.1995.1039
- Kumar, A., and J. J. Higdon, “Origins of the anomalous stress behavior in charged colloidal suspensions under shear.” Phys. Rev. E 82, 051401 (2010). https://doi.org/10.1103/PhysRevE.82.051401
- Giera, B., et al., “Mesoscale particle-based model of electrophoresis.” J. Electrochem. Soc. 162(11), D3030 (2015). https://doi.org/10.1149/2.0161511jes
- Bezerra, M. A, et al., “Response surface methodology (RSM) as a tool for optimization in analytical chemistry.” Talanta 76(5), 965 (2008). http://dx.doi.org/10.1016/j.talanta.2008.05.019
Publications and Presentations
- Giera, B., et al., "Mesoscale particle-based model of electrophoresis." J. Electrochem. Soc. 162(11), D3030 (2015). LLNL-JRNL-669534. https://doi.org/10.1149/2.0161511jes


