Stefan P. Hau-Riege (16-ERD-046)
Abstract
The in-focus spatial intensity distribution of x-ray free-electron laser pulses is commonly characterized by performing ablative imprints of thin gold films. In many cases, the range of the electrons generated in the gold by x-ray absorption far exceeds the beam size, and it is not clear if the results of imprint studies are compromised by electron transport. We used a combination of Monte Carlo transport and continuum models to determine the limitations of the imprint method for characterizing x-ray free-electron laser beam profiles. We found that, for x-ray energies in the range of 1 to 10 keV, the actual and measured beam diameters agree within 10 percent or better for beam diameters between 0.1 and 1 µm.
Background and Research Objectives
X-ray free-electron lasers (XFELs; Pellegrini 2016) are revolutionizing the physical and life sciences (Bostedt et al. 2016), in part because they produce extremely bright x-ray pulses that have a high degree of spatial coherence. With the help of wavefront-preserving optics, the pulses can be focused to very small beam diameters. At the Linac Coherent Light Source (LCLS), beam sizes as small as 0.1–0.3 µm are achieved routinely (Boutet and Williams 2010). A major challenge is the characterization of the pulses, in particular the beam profile in focus. Several methods that probe the beam either in focus or out of focus have been considered in the past (Chalupsky et al. 2011). Examples for indirect or out-of-focus probing include measuring the wavefront directly with a Hartmann sensor (Lenape et al. 2002) or imaging the intensity distribution using luminescence crystals like Ce:YAG (Kirm et al. 2005). This information is then used to back-propagate the wavefront to the focal plane. Direct or in-focus methods include ablative imprints based on XFEL-induced surface damage: the XFEL beam irradiates a solid, some material is ablated, and the beam is characterized by analyzing the resulting crater. A method proposed by Liu (1982) is used to map out the spatial beam intensity distribution by measuring the crater profile as a function of the incoming pulse energy.
In practice, imprints are commonly used because of their perceived robustness and ease of implementation. Typical imprint samples to characterize 1–10 keV XFEL pulses consist of thin gold films evaporated on a silicon dioxide (SiO2) glass substrate, often using a thin chromium layer to improve adhesion. When an XFEL pulse irradiates the sample, the optically opaque gold and chromium are evaporated, leaving only the transparent glass substrate behind. Using an optical microscope with back illumination, it is possible to conveniently automate the characterization of the shapes of the craters. The imprint method is based on the assumption that the temperature distribution in the x-ray-heated gold matches the x-ray intensity profile. Since x-ray absorption leads to the emission of fast electrons which carry most of the x-ray energy, the energy-deposition profile could be different due to electron transport. With electron stopping powers in gold ranging from 1.6 to 5.1 eV/mA for 1–10 keV electrons (Luo et al. 1991), it has been anticipated that this effect is particularly pronounced for submicron beam diameters. The goal of this project was to understand the effect of electron transport on x-ray beam imprinting. We used Monte Carlo methods to model the x-ray absorption and electron transport, and continuum models for the thermal heat conduction. Our results show that the imprint method is accurate even for relatively small beam diameters.
Scientific Approach and Accomplishments
In our simulations, we assumed that the x-ray energies of the XFEL pulses ranged from 1 to 10 keV, and that the pulse length was 100 fs or less. For these parameters, the x-ray–matter-interaction process can be broken down into three parts (Hau-Riege 2011): (1) x-ray absorption leads to the emission of fast electrons that equilibrate through elastic and inelastic scattering cascade processes in the material on the timescale of the pulse duration (Ziaja et al. 2005); (2) the warm electron gas heats the ions for less than a picosecond; (3) within about 10 ps, the sample equilibrates thermally and the evaporation of matter is initiated. X-ray absorption occurs through photoionization, leading to the emission of photoelectrons. Most of the absorption takes place in the gold layer due to gold’s large atomic charge number. In the x-ray range of 1 to 10 keV, only L- and M-shell electrons can absorb photons in gold. Such excited atoms relax through Auger decay under the emission of Auger electrons. Both photoelectrons and Auger-electrons are of relatively high energy, travel through the material ballistically, and transfer their energy to slower electrons through inelastic scattering. The slower electrons then heat the ions, leading to melting, boiling, and ablation of the material. For imprints, the x-ray fluence is relatively small so that a number of effects that occur at high fluences (such as electrostatic charging or changes in the x-ray absorption cross section and the electron stopping power) can be neglected.
It is preferable to use thin films as imprint samples (as opposed to bulk materials) because the material damage is easier to interpret. For soft x rays, the attenuation length is often smaller than the beam diameter and a well-defined crater is observed. For harder x rays, the penetration depth can exceed the beam diameter significantly, which can lead to cracking of the material, making the craters difficult to interpret. This can be avoided by using a highly absorbent thin film on a relatively transparent substrate. Only the surface of the sample will heat up and is ablated without significant cracking. Due to electron transport, the x-ray absorption profile, which we call x-ray dose, is generally different from the heating profile caused by the electrons, which we call electron dose. Electron transport and thermal conduction could significantly complicate the analysis of imprint experiments, especially for small beam diameters.
We used a two-step Monte Carlo model to describe the x-ray absorption and electron-transport processes (Hau-Riege et al. 2008). In the first step, the photon traverses the absorber stack and a random photoabsorption event occurs with a probability that is proportional to the product of the interaction cross section (Henke et al. 1993) and the photon fluence. The photon fluence in the material is computed using Beer’s law. For simplicity, we assumed that the radiation is nonpolarized and irradiates the sample at normal incidence so that the problem is rotationally symmetric around the center axis of the photon beam. We accounted for the dependency of the photoelectron emission profile on the absorption shell (Trzhaskovskaya et al. 2002). The ion then relaxes to the ground state under the emission of Auger electrons.
In the second step, we tracked the paths of the electrons through the material using a single-scattering model in which each elastic scattering event is handled individually (Joy 1995). When an electron traverses the material, it is undergoing elastic scattering, which is described using the Rutherford model (Newbury and Myklebust 1981; Reimer and Crafting 1976). In between scattering events, a modified Bethe equation is used to describe the energy loss due to inelastic scattering (Bethe 1930; Berger and Seltzer 1964; Joy and Luo 1989). This semiempirical approach avoids the nonphysical behavior of the Bethe expression at low energies by introducing a dependency of the mean ionization potential on electron energy. We tracked the electron stopping to compute the electron dose in the material.
Using temperature-dependent heat capacities (Touloukian and Bunco 1970), we converted the electron dose to a temperature distribution in the material. With this temperature distribution as initial conditions, we numerically solved Fourier’s law in two dimensions to model the equilibration process in the layer stack. In this computation, we considered the temperature dependence of the thermal conductivity and the heat capacity (Touloukian and Buyco 1970a, 1970b).
Our samples consisted of 40-nm gold on 5-nm chromium on glass SiO2 substrates. We assumed parameters because they could be encountered at LCLS’s end station for coherent x-ray imaging (CXI): The x-ray energy ranged from 1 to 10 keV, and the theoretically predicted focal diameters were 110 nm and 1.3 µm.
For the x-ray fluences considered in this report, the fraction of atoms that absorb a photon is small, so that the absorption cross sections of the atoms do not change significantly during the pulse, and the x-ray absorption profile follows Beer’s law throughout.
We followed the convention that the x-ray beam propagates in the positive z direction. The gold layer extended from 0 to 40 nm, the chromium layer from 40 to 45 nm, and the space above 45 nm was occupied by SiO2. The electron dose was highest at 1 keV since, in general, the energy deposition profile is more localized for electrons with smaller kinetic energies. With increasing kinetic energy, the electrons from the gold layer have an increasingly larger probability of leaving the gold, either escaping from the sample or depositing their energy in the chromium layer or in the glass. Therefore, for harder x-ray energies, the electron dose is generally smaller and concentrated closer to the center of the gold film. Since the electron stopping powers of chromium and SiO2 are much lower than for gold, they do not heat significantly.
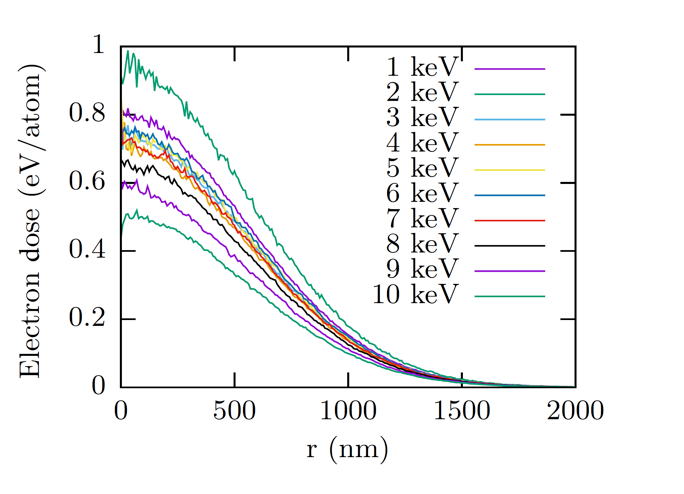
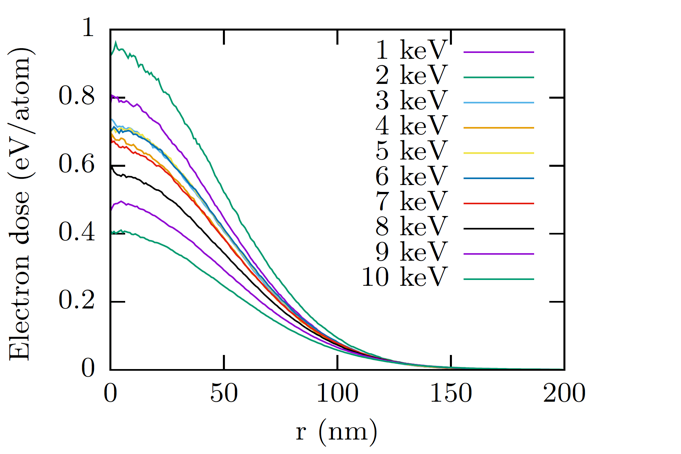
Figures 1 and 2 show the radial dependence of the electron dose averaged through the thickness of the gold layer for a beam with focal diameters of 1.3 µm and 110 nm, respectively.
Figure 1. Average electron dose in the gold layer for an x-ray free-electron laser beam with a focal diameter of 1.3 µm, a peak x-ray dose of 0.95 eV/atom, and a range of x-ray energies.
Figure 2. Average electron dose in the gold layer for an x-ray free-electron laser beam with a focal diameter of 110 nm, a peak x-ray dose of 0.95 eV/atom, and a range of x-ray energies.
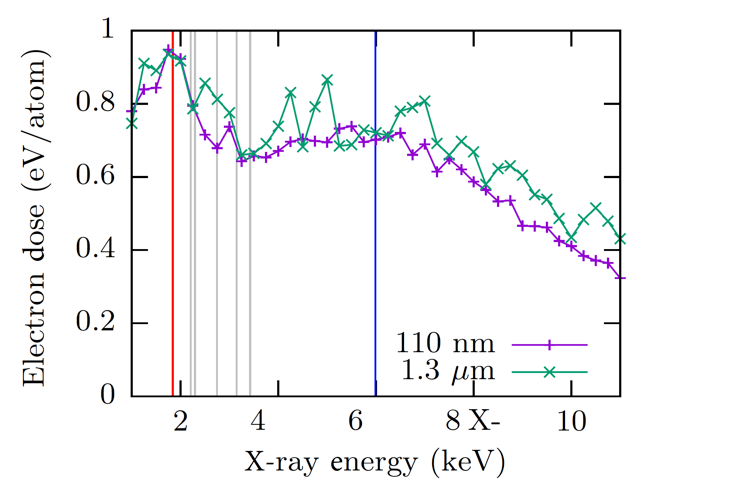
For all x-ray energies that we considered, the profiles were close to a Gaussian distribution. However, the magnitude of the Gaussian distributions depends on the x-ray energy strongly. In general, larger x-ray energies lead to smaller electron doses since the electrons diffuse further into the material. This trend is not followed when the x-ray energy is close to a gold absorption edge. Just above an edge, the energy of the photoelectron is small and the energy of an Auger electron is maximal, leading to a larger spread of the absorbed x-ray energy in the material. On the other hand, when the absorption edge is about half the x-ray energy, the photoelectron and Auger electron have similar energies, and so stay more local. Figure 3 depicts the electron dose in gold at the center of the beam (r = 0) and averaged through the thickness of the gold layer as a function of the x-ray energy. Also depicted in that graph are the absorption edges of different materials.
Figure 3. Average electron dose in the gold layer at the beam center (r = 0) for an x-ray free-electron laser beam with a peak x-ray dose of 0.95 eV/atom and a focal diameter of 110 nm (magenta) and 1.3 µm (green). The vertical lines indicate x-ray absorption edges in silicon (red), gold (grey), and chromium (blue).
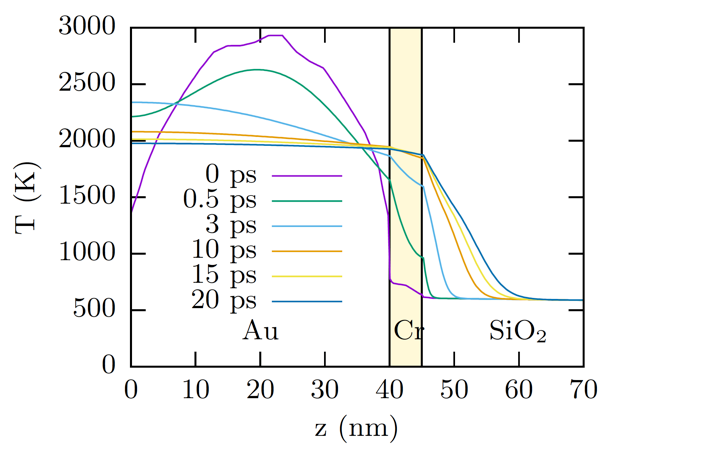
Following the electron transport, the electrons and ions equilibrate among each other in less than a picosecond. Since the melting temperature of gold is only 1,064 °C, the gold is molten at this point. In the next few picoseconds, the temperature gradient is reduced through thermal conduction and some energy is transported into the substrate. The evolution of the temperature profile due to heat conduction is shown in Figure 4.
Figure 4. Temperature evolution in a gold/chromium/silicon dioxide (Au/Cr/SiO2) stack during the first 20 ps after irradiation with an 8 keV x-ray free-electron laser beam with a peak x-ray dose of 0.95 eV/atom.
The temperature inside the gold equilibrates quickly through the film thickness, after which the chromium layer heats up and eventually melts. The energy transport into the SiO2 substrate is slow because SiO2 is a poor thermal conductor.
We also found that, at least during the first 20 ps, the energy transport in the plane of the gold and chromium films was much slower than transport into the substrate because the out-of-plane temperature gradients were much larger than the in-plane gradients.
Figure 5 shows the evolution of the thickness-averaged dose in the gold layer as a result of thermal conduction.
Figure 5. Evolution of the average dose in the gold layer during the first 20 ps after irradiation with an 8 keV X-ray free-electron laser beam with a peak x-ray dose of 0.95 eV/atom.
Consistent with the slow temperature rise in the substrate, the drop is not very significant during the first few picoseconds. Our results indicate that it may not be necessary to fully simulate the thermal dynamics. Instead, it seems sufficient to compute the energy deposited in the gold layer, the chromium layer, and the top 5 nm of the substrate (corresponding to roughly half the conduction depth in Figure 4), calculate the average temperature over these layers, and from that compute the energy in the gold. We opted for this method, also taking into account the enthalpy of melting.
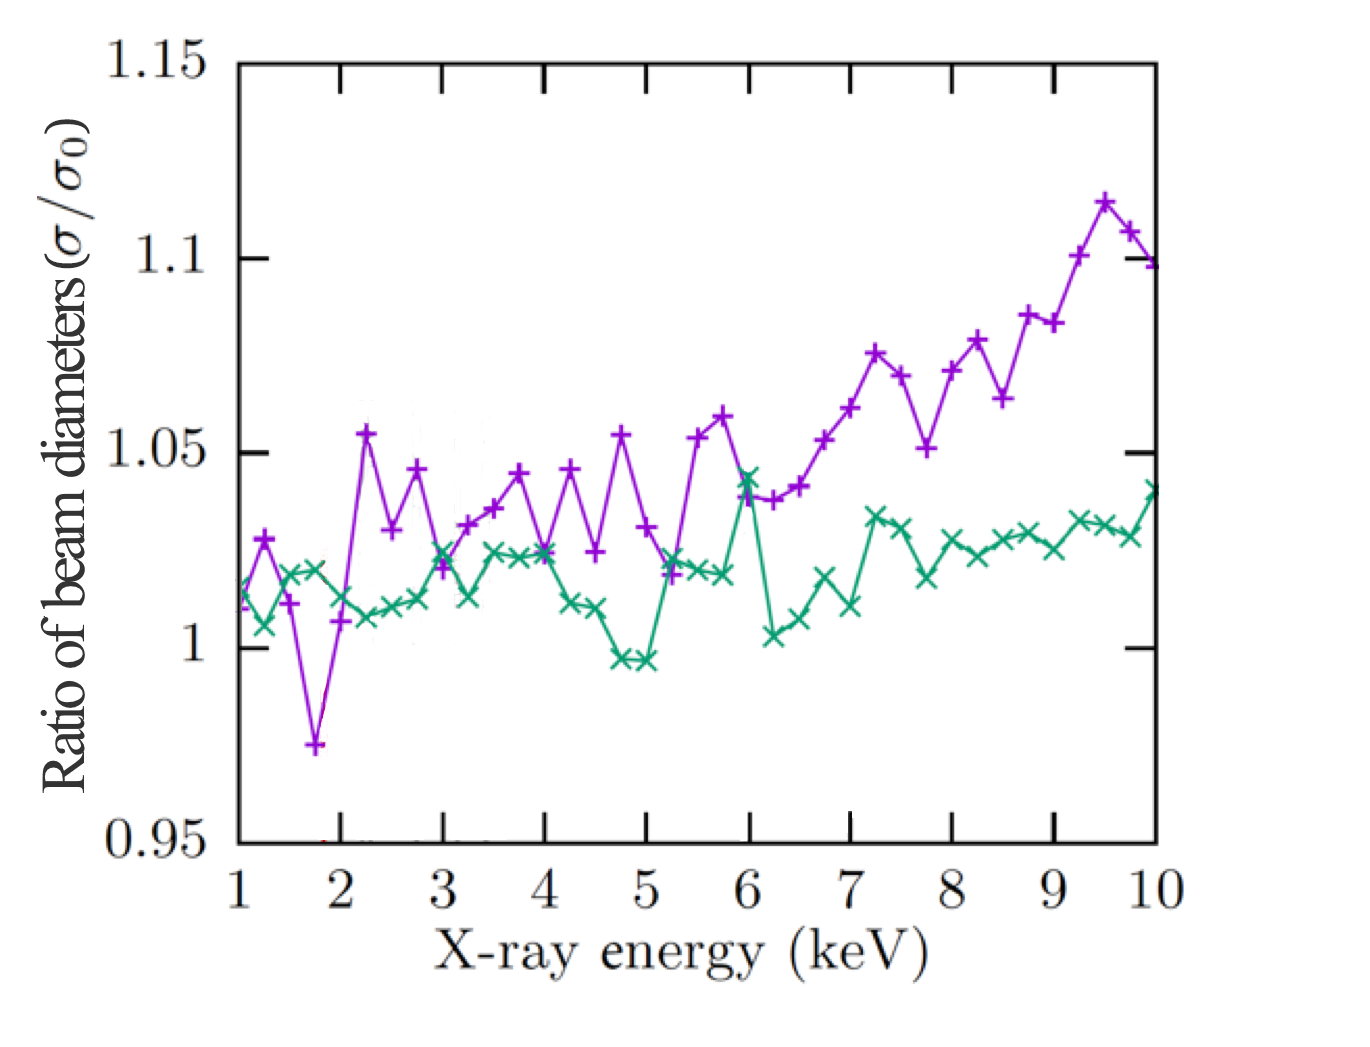
Gold reaches its boiling point and evaporates at an electron dose of 0.95 eV/atom. We used this threshold dose and the computed radial dependence of the energy dose in the gold layer to determine the imprint crater sizes. We then applied Liu’s method (Liu 1982) to extract the beam diameter and compare it to the actual diameter. Figure 6 shows the ratio of these two diameters as a function of the x-ray energy.
Figure 6. Predicted beam diameter of 110 nm (magenta line) relative to the actual beam diameter of 1.3 µm (green line).
We found that, for most x-ray energies, the actual beam diameter agreed with the extracted beam diameter within five percent. As expected, the agreement was generally better for lower x-ray energies and for larger beam diameters because low-energy electrons tend to be more localized, and the x-ray dose profile for larger beams is less prone to be smeared out by electron transport.
Impact to Mission
This work advanced our understanding of fundamental plasma physics processes relevant to NNSA programs. We simulated high-intensity x-ray and matter interaction at the intersection of high-energy-density science and biology using tools developed at Lawrence Livermore National Laboratory for a variety of applications. The research results will benefit plasma physics research in support of the Laboratory’s strategic focus area in stockpile stewardship science and its core competency in high-energy-density science.
Conclusion
In summary, we used a combination of Monte Carlo and continuum methods to study the performance of the imprint method to characterize XFEL beam profiles in focus. We found that, for the x-ray energy discussed in this report, the actual and measured beam diameters agree to within 10 percent or better for beam diameters between 0.1 and 1 µm. It is remarkable that our results show that the imprint method works even for small beam diameters of 110 nm and x-ray energies in the range of 1 to 10 keV (Ashley et al. 1976).
References
Ashley, J. C., et al. 1976. “Calculations of Mean Free Paths and Stopping Powers of Low Energy Electrons (10 kev) in Solids Using a Statistical Model.” IEEE Transactions on Nuclear Science 23.
Berger, M. J. and S. M. Seltzer, 1964. “Studies in the Penetration of Charged Particles in Matter.” National Academy of Sciences – National Research Council Nuclear Science Series Report 39, Publication 1133.
Bethe, H. A., 1930. “Zur Theorie des Durchgangs Schneller Korpuskularstrahlen Durch Materie.” Annalen der Physik 397 (3): 325–400.
Bostedt, C., et al. 2016. “Linac Coherent Light Source: The First Five Years.” Review of Modern Physics 88(1). doi: 10.1103/RevModPhys.88.015007.
Boutet, S. and G. J. Williams, 2010. “The Coherent X-ray Imaging (CXI) Instrument at the Linac Coherent Light Source (LCLS).” New Journal of Physics 12.
Chalupsky, J., et al. 2011. “Comparing Different Approaches to Characterization of Focused X-ray Laser Beams.” Nuclear Instruments and Methods in Physics Research 631(1):130–133.
Hau-Riege S. P., et al. 2008. “Measurement of X-ray Free-Electron-Laser Pulse Energies by Photoluminescence in Nitrogen Gas.” Journal of Applied Physics 103(5): 053306–053309. doi: 10.1063/1.2844478.
Hau-Riege, S., 2011. "High Intensity X-rays—Interaction with Matter." Wiley-VCH Verlag. doi: 10.1002/9783527636365.
Henke, B. L., et al. 1993. “X-ray Interactions: Photoabsorption, Scattering, Transmission, and Reflection at E = 50 30, 000 eV, Z = 1 92.” Atomic Data and Nuclear Data Tables 54(2):181–342. doi: 10.1006/adnd.1993.1013.
Joy, D. C., 1995. "Monte Carlo Modeling for Electron Microscopy and Microanalysis." New York: Oxford University Press.
Joy, D. C. and S. Luo. 1989. “An Empirical Stopping Power Relationship for Low-Energy Electrons.” Scanning 11(4):176–180. doi: 10.1002/sca.4950110404.
Kirm, M., et al. 2005. “Influence of Excitation Density on Luminescence Decay in Y3Al5O12:Ce and BaF2 Crystals Excited by Free Electron Laser Radiation in VUV.” Physica Status Solidi (C) 2(1):649–652. doi: 10.1002/pssc.200460255.
LePape, S., et al. 2002. “Electromagnetic-Field Distribution Measurements in the Soft X-ray Range: Full Characterization of a Soft X-ray Laser Beam.” Physical Review Letters 88(18): 183901. doi: 10.1103/PhysRevLett.88.183901.
Liu, J. 1982. “Simple Technique for Measurements of Pulsed Gaussian-Beam Spot Sizes.” Optics Letters 7(5):196–198. doi: 10.1364/OL.7.000196.
Luo, S. 1991. “Experimental Measurements of Electron Stopping Power.” Radiation Effects and Defects in Solids 117.
Newbury, D. E. and R. L. Myklebust. 1981. "Analytical Microscopy." Edited by R. Geiss. San Franscisco Press, Berkeley, CA.
Pellegrini, C. 2016. “X-ray Free-Electron Lasers: From Dreams to Reality.” Physica Scripta T169(T169):014004. doi: 10.1088/1402-4896/aa5281.
Touloukian, Y. and E. Buyco. 1970a. "Thermophysical Properties of Matter." The TPRC Data Series: Specific Heat-Metallic Elements and Alloys, Volume 4.
Touloukian, Y., et al. 1970b. "Thermophysical Properties of Matter." The TPRC Data Series: Thermal Conductivity - Metallic Elements and Alloys, Volume 1.
Trzhaskovskaya, M., et al. 2002. “Photoelectron Angular Distribution Parameters for Elements Z = 55 to Z = 100 in the Photoelectron Energy Range 100–5000 eV.” Atomic Data and Nuclear Data Tables 82(2):257–311. doi: 10.1006/adnd.2002.0886.
Ziaja, B., et al. 2005. “Unified Model of Secondary Electron Cascades in Diamond.” Journal of Applied Physics 97(6): 4905–064905. doi: 10.1063/1.1853494.


